How to Master Business Process Mapping in 2025

Mastering Business Process Mapping in 2025 requires a clear understanding of how organizations adopt and implement optimization steps. Companies see significant gains in efficiency and productivity through process mapping. Recent statistics show 48% of organizations have formal programs, and 80% of IT leaders prioritize these efforts:
Statistic | Value |
|---|---|
Organizations with a formal BPM program | 48% |
IT leaders prioritizing BPM | 80% |
Executives citing lack of buy-in as a failure cause | 96% |
Business Process Mapping helps reduce operational costs, improves output quality, and increases satisfaction for both employees and customers. Anyone can learn these steps and achieve measurable results.
Key Takeaways
Business Process Mapping enhances efficiency and productivity by visualizing workflows and identifying inefficiencies.
Involve stakeholders in the mapping process to ensure accuracy and gather diverse perspectives.
Choose the right type of process map based on your specific needs, such as flowcharts for simple tasks or swimlane diagrams for complex workflows.
Regularly review and update process maps to keep them relevant and reflective of current operations.
Utilize automation tools to streamline repetitive tasks, allowing teams to focus on more valuable work.
Define the scope of your mapping project clearly to avoid confusion and ensure everyone understands the objectives.
Use simple symbols and clear documentation to make process maps easy to understand for all stakeholders.
Adopt new technologies and methodologies to continuously improve processes and adapt to changing business needs.
Business Process Mapping Basics

What Is Business Process Mapping
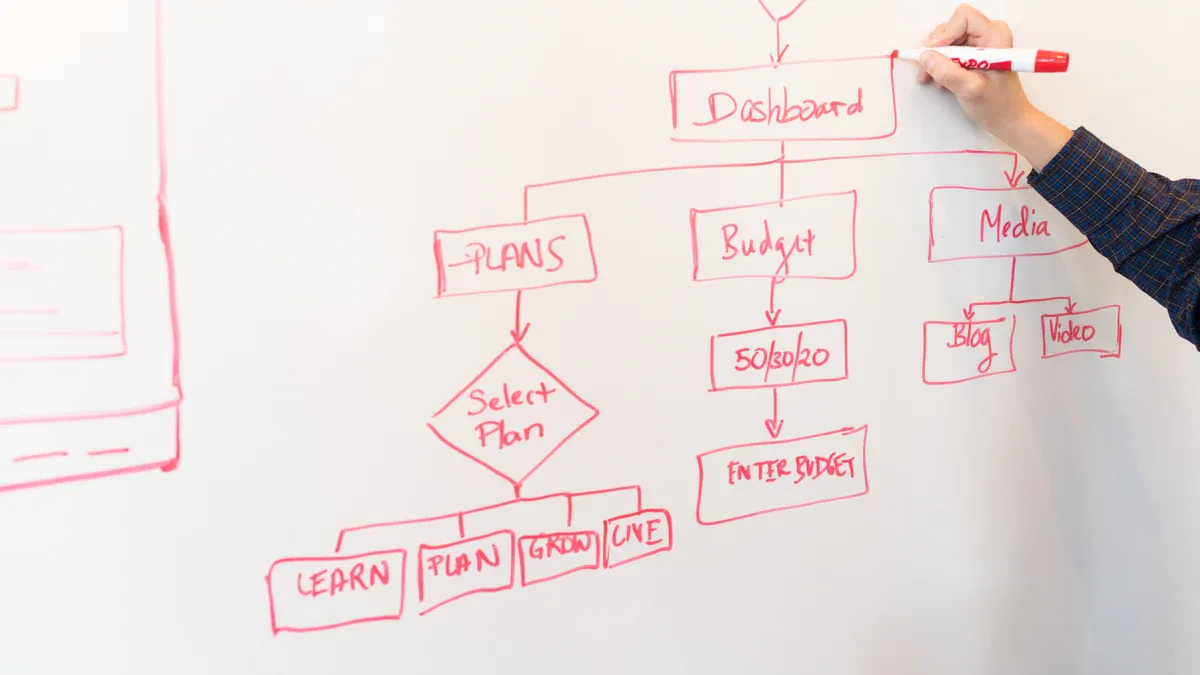
Business Process Mapping provides a visual way to understand how work flows through an organization. Experts describe it as a method for visualizing workflows, identifying inefficiencies, and enhancing communication across departments. Teams use this approach to define processes clearly, gather input from stakeholders, outline and sequence steps, and create visual representations that guide optimization.
Tip: Visual maps help everyone see the big picture and spot areas for improvement quickly.
A typical process map shows the start and end points, the steps involved, and decision points. This clarity allows teams to work together and improve how tasks get done.
Key Benefits
Business Process Mapping offers several important benefits for organizations. The most cited advantages include:
Increased visibility across the company.
Identification of problems and solutions.
Consistency and efficiency in operations.
Compliance with industry regulations.
Benefit | Description |
|---|---|
Clear and Standardized Directions | Provides a roadmap for operations, reducing ambiguity and enhancing efficiency. |
Effective Risk Management | Helps identify potential risks and inefficiencies, allowing for proactive mitigation. |
Improved Communication | Visually represents processes, fostering understanding and teamwork among employees. |
Operational Excellence | Optimizes processes for quality results with minimal waste, contributing to competitive advantage. |
Organizations measure the return on investment by identifying revenue-draining activities, calculating cost savings from automation, and reducing losses from regulatory missteps. For example, automating accounts receivable tasks led to a 25% reduction in outstanding payments for one company. Teams also gain more time for profitable activities when administrative processes become more efficient.
Why It Matters in 2025
Business Process Mapping plays a critical role in helping companies succeed in 2025. It helps teams understand the causes and consequences of their actions. By identifying gaps and problems, organizations can achieve their goals more effectively. High awareness of process modeling leads to better identification of inefficiencies and risks.
Note: Mapping processes supports risk management and helps teams gather ideas for performance improvements.
This approach also documents knowledge and raises awareness of roles and responsibilities. Companies reduce unnecessary complexity and enhance team performance. As businesses face new challenges and rapid changes, clear process maps ensure everyone knows what to do and how to do it.
Types of Process Maps
Modern organizations use several types of process maps to visualize and improve their workflows. Each type serves a unique purpose and fits different business needs. The following table summarizes the main types found in today’s business environments:
Type of Process Map | Description | Best Use Case |
|---|---|---|
Flowchart | Simplest type, shows inputs, outputs, and steps from start to finish. | Documenting processes during onboarding or brainstorming. |
High-level process map | Bird’s-eye view, focuses on key phases without details. | Sharing overviews with execs or external partners. |
Detailed process map | Includes all actions, decisions, and responsibilities. | Analyzing complex workflows and finding inefficiencies. |
Swimlane map | Organizes processes by separating responsibilities into lanes. | Clarifying roles in multi-team processes. |
Value stream map | Tracks the journey of a product/service from start to delivery. | Finding opportunities to reduce waste. |
SIPOC diagram | High-level view of a workflow, structured chart. | Outlining what’s involved before mapping the full workflow. |
BPMN | Standardized method using unique symbols for tasks and events. | Mapping structured processes needing clarity across systems. |
Flowcharts
Flowcharts represent the most basic form of process mapping. They show the sequence of actions from start to finish, making them easy to understand. Teams use flowcharts to document simple tasks, especially during onboarding or brainstorming sessions. The following table highlights how flowcharts differ from other process maps:
Aspect | Flowcharts | Process Maps |
|---|---|---|
Level of Detail | Simpler, focuses on sequence of actions | More detailed, includes inputs, outputs, and interactions |
Application | Best for straightforward tasks | Ideal for complex processes needing in-depth understanding |
Visibility | Limited to direct paths between steps | Shows interconnected nature of tasks and departments |
Flowcharts work best when a process has a clear path and few decision points. They help teams visualize steps quickly and identify basic improvements.
Swimlane Diagrams
Swimlane diagrams organize processes by dividing responsibilities into lanes. Each lane represents a team, department, or role. This format clarifies who does what and when. Swimlane diagrams provide several advantages:
Offers a comprehensive overview of the process
Aligns expectations and goals
Identifies and eliminates unnecessary or inefficient steps
Optimizes the process flow
Enhances process performance, quality, and customer satisfaction
Swimlane diagrams clarify accountabilities, highlight handoffs and interactions, and improve communication and collaboration across the process.
Teams often use swimlane diagrams for cross-functional projects. These diagrams make it easier to spot bottlenecks and improve teamwork.
Value Stream Maps
Value stream maps track the journey of a product or service from start to delivery. This type of map helps organizations visualize their processes and identify inefficiencies. By comparing current and future state maps, teams can strategize to eliminate waste and boost productivity. Value stream mapping serves as a lean management technique that analyzes workflow, aiming to maximize value creation while minimizing waste. Reducing or eliminating waste through value stream mapping can significantly enhance a company's profitability, as it helps uncover the root causes of waste and its sources.
Business Process Mapping often uses value stream maps to support continuous improvement. Teams gain insight into where resources go and how to streamline operations for better results.
SIPOC
SIPOC stands for Supplier, Input, Process, Output, and Customer. This model gives teams a high-level overview of a process. Many organizations use SIPOC at the start of process improvement projects. It helps teams define the scope and boundaries before diving into details.
The SIPOC model identifies all relevant elements of a process improvement project.
Each letter in SIPOC represents a key part:
Supplier: The person, team, or system that provides inputs.
Input: The materials, information, or resources needed for the process.
Process: The set of steps or activities that transform inputs into outputs.
Output: The products, services, or results produced by the process.
Customer: The person or group who receives the outputs.
Teams often use SIPOC in the "define" phase of Six Sigma projects. This model helps outline the scope and clarify what the process includes. SIPOC also highlights accountability and stakeholder roles, which supports continuous improvement.
Note: SIPOC diagrams serve as a starting point for creating more detailed process maps, such as flowcharts or swimlane diagrams.
SIPOC works well for complex projects. It helps teams see the big picture and ensures everyone understands the process from start to finish. By using SIPOC, organizations can align their goals and focus on what matters most.
Choosing the Right Type
Selecting the best process map depends on the specific needs of the business scenario. Teams should consider several criteria to make the right choice.
Criteria | Description |
|---|---|
Specific Process | Define which process or workflow needs mapping and set clear boundaries. |
Data Collection | Gather information through interviews, observations, and document reviews. |
Process Boundaries | Identify where the process starts and ends, including triggers and outcomes. |
Task Identification | List all tasks in order and document them clearly. |
Dependencies | Note relationships between activities and how information flows. |
Inputs/Outputs | Determine what goes into and comes out of each step. |
Decision Points | Mark points where choices are made and set criteria for decisions. |
Mapping Techniques | Choose the right mapping method, such as flowcharts or swimlane diagrams. |
Regular Updates | Review and update the map to keep it accurate and useful. |
Different types of process maps fit different situations:
Flowchart: Best for spotting bottlenecks and redundancies in simple processes.
Swimlane diagram: Useful for showing roles and responsibilities across teams.
Value stream map: Helps find ways to improve lead time and reduce waste.
BPMN diagram: Good for modeling complex processes and testing changes.
Data flow diagram: Shows how data moves through systems.
SIPOC diagram: Provides a high-level overview of process elements.
Teams should match the map type to their goals. For example, a SIPOC diagram works well when starting a new project or defining a process. A swimlane diagram helps when clarifying roles in a cross-functional team. Regular updates keep process maps relevant as business needs change.
Tip: Start with a high-level map like SIPOC, then move to detailed maps as you learn more about the process.
Process Mapping Symbols and Tools
Common Symbols
Understanding the symbols used in process maps helps teams create clear and effective diagrams. Each symbol represents a specific action or decision within a workflow. The table below shows the most commonly used symbols in Business Process Mapping and what they represent:
Symbol Type | Symbol Representation | Description |
|---|---|---|
Start/End | Oval or Circle | Marks the beginning and end points of a process. |
Process | Rectangle | Represents an activity or task within the process. |
Decision | Diamond | Indicates a decision point where the process can branch based on conditions. |
Arrow | N/A | Depicts the direction of the flow of the process. |
Input/Output (Data) | Parallelogram | Highlights input/output operations, such as user input or system outputs. |
Manual Input | Trapezoid | Indicates where human intervention is required. |
Display | N/A | Represents the display of information. |
Start Events | N/A | Shows where the process begins, triggered by specific conditions. |
End Events | N/A | Denotes the process’s conclusion, tied to outcomes. |
Exclusive Gateway | N/A | Marks a decision point with only one outgoing path. |
Parallel Gateway | N/A | Allows multiple paths to proceed at the same time. |
Inclusive Gateway | N/A | Indicates a decision point with one or more possible paths. |
Event-Based Gateway | N/A | Directs flow based on specific events. |
Complex Gateway | N/A | Handles advanced decision-making with combined conditions. |
Start/End
Teams use ovals or circles to show where a process begins and ends. These symbols help everyone identify the boundaries of a workflow.
Steps
Rectangles represent tasks or activities. Each rectangle shows a specific action that moves the process forward.
Decisions
Diamonds indicate decision points. At these points, the process can branch based on conditions or choices.
Connectors
Arrows show the direction of flow. They connect symbols and guide users through each step of the process.
Business Process Mapping Tools
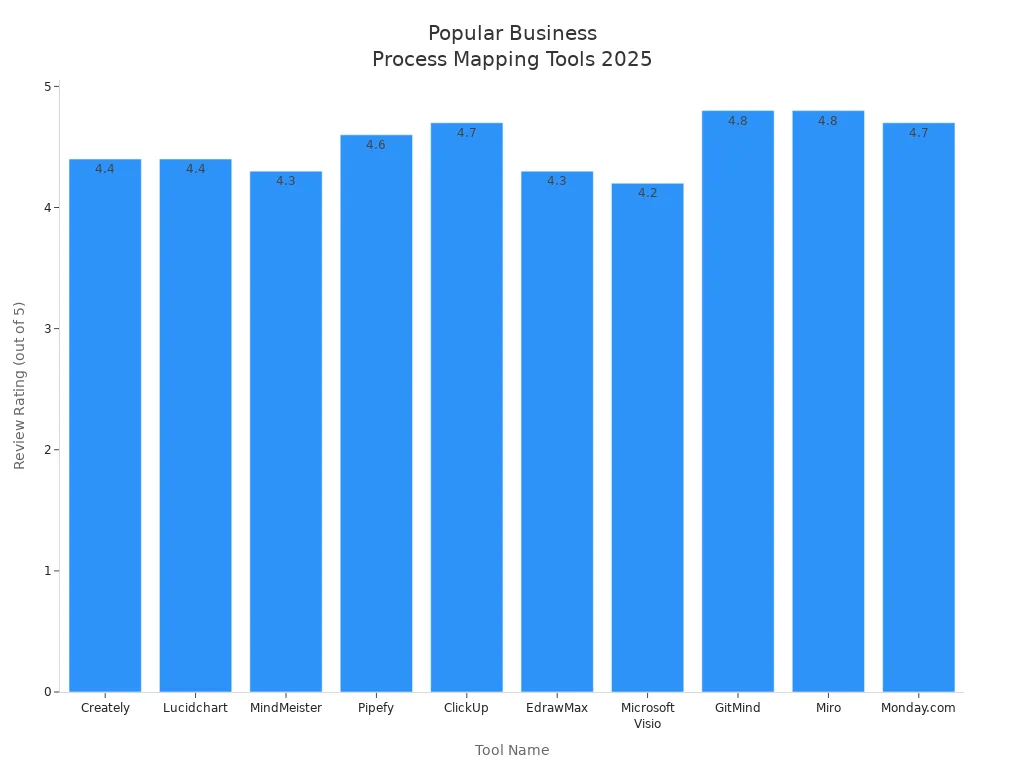
Selecting the right tool makes process mapping easier and more efficient. In 2025, several platforms stand out for their features and usability. The table below highlights popular tools and their key features:
Tool Name | Review Rating | Pricing | Key Features |
|---|---|---|---|
Creately | 4.4/5 | $5/month/user | Visual workspace, process mapping, real-time collaboration, BPMN shape libraries |
Lucidchart | 4.4/5 | Free to start, enterprise pricing | Intelligent diagramming, cloud collaboration, integrates with Microsoft 365, Zoom, Slack |
MindMeister | 4.3/5 | Free basic, $27.29/month | Collaborative mind mapping, visually appealing themes, integration with popular software |
Pipefy | 4.6/5 | Free basic, enterprise pricing | Workflow automation, low-code tools, AI for custom processes |
ClickUp | 4.7/5 | Free to start, $12/month | All-in-one productivity hub, task management, process mapping templates |
EdrawMax | 4.3/5 | $245 lifetime plan | Diagramming tool, AI features, 280 types of visualizations, social sharing |
Microsoft Visio | 4.2/5 | $5/month without commercial plan | Professional diagramming, customizable templates, real-time collaboration |
GitMind | 4.8/5 | Free for up to 10 mind maps | Collaborative mind mapping, AI features, drag-and-drop functionality |
Miro | 4.8/5 | $0-$16/month | Online collaborative whiteboard, real-time editing, various templates |
Monday.com | 4.7/5 | $9-$19/month | Work operating system, customizable boards, automation capabilities |
Cloud Platforms
Cloud-based platforms allow teams to collaborate from anywhere. These tools offer real-time updates and seamless communication. Teams can share process maps instantly and receive feedback without delays.
AI Tools
AI-powered tools automate repetitive tasks and suggest improvements. They help teams analyze workflows and identify bottlenecks. AI features also support custom process creation and optimization.
Collaboration Features
Modern tools include features that boost teamwork. Teams benefit from:
Real-time collaboration that connects users across locations.
Visual representations that simplify complex workflows.
Customizable templates for faster process mapping.
Immediate input from stakeholders for quick optimization.
Easy export and sharing options for distributing maps.
Business Process Mapping becomes more effective when teams use platforms that support communication and coordination. These features help organizations improve productivity and reduce bottlenecks.
How to Create a Process Map
Define Scope
Defining the scope sets the foundation for a successful process map. Teams begin by gathering stakeholder requirements. They document deliverables to clarify expectations. Establishing a change control process helps manage updates and revisions. These steps ensure that everyone understands the boundaries and objectives of the mapping project.
Tip: Clear scope prevents confusion and keeps the project focused.
A well-defined scope answers key questions:
What process will the team map?
Where does the process start and end?
What outcomes should the process deliver?
Teams use these answers to set boundaries and avoid mapping unnecessary steps. They also identify triggers and outcomes, which guide the mapping process.
Step | Description |
|---|---|
Gather stakeholder requirements | Collect input from all relevant parties. |
Document deliverables | List expected outputs and results. |
Establish change control | Set rules for making updates and changes. |
Gather Team and Info
Building the right team and collecting accurate information are essential for effective process mapping. Teams involve multiple people from different departments. This approach brings diverse perspectives and improves accuracy. Members challenge assumptions by asking questions and exploring current practices. Observing the process in real-time ensures the map reflects actual workflows.
Teams set key performance indicators (KPIs) to measure effectiveness. They revisit process maps regularly to keep them up to date. These practices help organizations identify gaps and areas for improvement.
Involve multiple people to gather different viewpoints.
Challenge assumptions to uncover hidden problems.
Observe the process as it happens for accuracy.
Quantify metrics and goals to track performance.
Revisit maps periodically to maintain relevance.
Note: A diverse team creates a more complete and reliable process map.
Identify Steps
Identifying each step in the process requires careful analysis. Teams visualize the workflow to see how tasks connect. Business process analysis provides a structured way to find improvement opportunities. Process mining tools analyze data and reveal inefficiencies or bottlenecks.
Teams follow a sequence to ensure thoroughness:
Define the process clearly.
Identify opportunities for improvement.
Design performance measures.
Analyze problems systematically.
Implement process improvements.
Monitor business process performance.
Teams use these steps to break down complex workflows into manageable tasks. They keep process maps clear and avoid overcrowding by limiting each map to no more than ten tasks. This rule helps maintain clarity and makes the map easier to understand.
Callout: Limiting each process map to ten tasks keeps diagrams simple and actionable.
Business Process Mapping helps teams visualize steps, analyze problems, and monitor performance. This approach supports continuous improvement and ensures that organizations achieve their goals.
Select Tools
Selecting the right process mapping tool shapes the success of any mapping project. Teams should match the tool to their business needs and the complexity of their processes. A good tool makes mapping easier and helps everyone stay engaged.
Factor | Description |
|---|---|
The tool should be accessible to all stakeholders to maintain engagement and avoid workflow blindspots. | |
Collaboration features | Real-time collaboration is essential for input from various contributors, preventing version inconsistencies. |
Integration capabilities | The ability to integrate with existing systems saves time and avoids manual data handling. |
Support and training | Robust support and training ensure users can effectively utilize the tool without extensive upfront training. |
Control user permissions | Limiting access helps prevent unauthorized changes and maintains the integrity of the process maps. |
Teams should also consider these points when choosing a tool:
Identify specific business needs and goals for the software.
Assess the complexity of the processes to be mapped.
Choose software that is easy for the team to navigate.
Ensure the tool supports real-time collaboration.
Check if the tool integrates with current technology.
Look for scalability to support future growth.
Evaluate the cost to fit the project budget.
Research the vendor’s reputation and user feedback.
Tip: The best tool fits the team's workflow and encourages everyone to participate.
Draft Map
Drafting the initial process map brings ideas and information together into a visual format. Teams can use several methods to gather details and create a first draft:
Individual staff or small group interviews help collect information for simple processes.
Facilitated discovery workshops work well for larger groups and provide a high-level view.
Analysis of existing documentation can save time if accurate documents already exist.
Direct work observation allows teams to see tasks as they happen, which is useful for manual processes.
Business analysis design helps when mapping new or re-engineered processes.
Importing or using existing process documentation can speed up the drafting process.
Teams should keep the map simple and avoid overcrowding. Limiting each process map to no more than ten tasks helps maintain clarity and makes the map easier to understand. Each step should have a clear label and logical flow. Teams can use sticky notes, digital whiteboards, or specialized software to arrange steps and decision points.
Callout: A clear draft helps everyone see the process and spot areas for improvement.
Validate and Refine
Validation ensures the process map matches reality and meets the team's needs. Teams should involve stakeholders in this step to catch errors and fill gaps.
Step | Description |
|---|---|
1 | Gather feedback from team members involved in the process to identify discrepancies and gaps. |
2 | Conduct a walkthrough of the process with stakeholders to visualize and validate each element of the map. |
3 | Make adjustments based on insights gained to enhance clarity and functionality of the process map. |
Teams can follow these actions:
Test the process map by walking through each step with stakeholders.
Confirm that the map reflects the actual workflow.
Identify and fix missing steps or inconsistencies before finalizing.
Once the team reviews the map, they should make necessary adjustments. This step improves the accuracy and usefulness of the process map. Regular feedback and refinement help the map stay relevant as processes change.
Note: Validating with stakeholders builds trust and ensures the process map supports real-world operations.
Finalize and Share
Finalizing a process map means making sure it is clear, accurate, and ready for use. Teams should focus on clarity and transparency. They use simple symbols so everyone can understand the map. This step helps all stakeholders see the process without confusion.
A successful process map involves more than just drawing steps. Teams must engage all stakeholders. They invite people from different departments to review the map. This approach captures important details and builds a shared vision. When everyone participates, the map reflects real work, not just theory.
Teams also create comprehensive documentation. They mark decision points clearly. This practice helps users understand how choices affect the process. Good documentation makes it easier to train new employees and maintain quality.
Before sharing the map, teams gather for a final validation. They walk through each step together. This review helps find any gaps between the map and actual practice. Teams fix mistakes and make sure the map matches what happens in real life.
The table below summarizes key strategies for finalizing and sharing process maps:
Strategy | Description |
|---|---|
Be clear and transparent | Use simple symbols to ensure clarity and accessibility for all stakeholders. |
Ensure you engage all stakeholders | Involve relevant stakeholders to capture process nuances and foster a shared vision. |
Create comprehensive documentation | Clearly mark decision points to understand their impact on the process. |
Get your team together for validation | Conduct a walk-through to identify gaps between the process map and actual practice. |
Develop a plan for regular updates | Regularly update process maps to reflect current operations, making them living documents. |
After validation, teams share the finalized process map with major stakeholders. They use digital platforms or cloud-based tools for easy access. Sharing the map ensures everyone stays informed and can give feedback. Teams also develop a plan for regular updates. This step keeps the process map current as operations change.
Tip: Treat process maps as living documents. Regular updates help teams adapt to new challenges and keep processes efficient.
To summarize, teams should follow these steps when finalizing and sharing a process map:
Share the finalized process map with major stakeholders for feedback.
Ensure the map accurately represents the process.
Conduct a thorough review with team members to confirm completeness.
By following these strategies, organizations make sure their process maps remain useful, accurate, and relevant. This approach supports continuous improvement and helps everyone work toward common goals.
Best Practices
Keep It Simple
Clear process maps help systems and teams work efficiently. Teams define documentation rules to keep maps consistent and easy to read. They use minimal elements, which makes each map self-explanatory. Simple maps allow clients to understand workflows without confusion. Teams outline outcomes and assign roles, so everyone knows their responsibilities.
Best Practice | Description |
|---|---|
Define Documentation Rules | Establish rules and standards for process mapping to ensure consistency and ease of understanding. |
Embrace Elegant Simplicity | Use minimal elements in process maps to enhance clarity and functionality, making them self-explanatory. |
Define Outcomes and Roles | Clearly outline the expected outcomes and assign roles to streamline the mapping process. |
Teams use decision gates to show different paths. Each process ends with a clear event, so users know when tasks finish. Systems that follow these steps avoid confusion and reduce errors.
Tip: Simple process maps help new team members learn faster and improve overall productivity.
Involve Stakeholders
Stakeholder involvement increases the accuracy and effectiveness of process maps. Teams invite stakeholders to share feedback, which validates assumptions and improves engagement. Clients at systems and teams see better results when everyone participates in mapping.
Evidence | Explanation |
|---|---|
Successful stakeholder mapping requires adherence to established best practices that ensure accuracy, completeness, and practical value. | Following best practices leads to more effective stakeholder maps and better project outcomes. |
Effective stakeholder mapping incorporates feedback from the stakeholders themselves. | Feedback helps validate mapping assumptions and improves engagement effectiveness. |
A stakeholder map gives a clear visual of relationships.
Teams identify the best ways to engage each group.
Communication improves among all stakeholders.
Teams that involve stakeholders create maps that reflect real workflows. This practice helps systems and teams deliver results that match client needs.
Note: Stakeholder feedback ensures process maps stay relevant and practical.
Use Automation
Automation plays a key role in modern Business Process Mapping. Systems and teams use automation to streamline tasks, such as filing and regulatory tracking. Automation allows employees to focus on valuable work, while routine processes run automatically.
Role of Automation in Business Process Mapping | Description |
|---|---|
Automation integrates processes and technology, improving efficiency in tasks like filing and regulatory tracking. | |
Supporting Employees | Automation allows employees to focus on more valuable tasks by handling routine processes. |
Evaluating Current Processes | Reviewing workflows helps identify areas for automation, enhancing overall productivity. |
Identifying Mundane Tasks | Recognizing repetitive tasks allows firms to automate them, improving employee satisfaction and efficiency. |
Teams review workflows to find tasks that can be automated. Clients at systems and teams benefit from faster processes and higher satisfaction. Automation also helps teams identify and remove bottlenecks.
Callout: Automation frees up time for teams to focus on innovation and growth.
Review Regularly
Teams maintain effective business process maps by reviewing them on a regular schedule. Regular reviews help organizations keep their maps accurate and useful. When teams review process maps, they spot outdated steps and adjust for new business needs. This practice supports continuous improvement and helps everyone follow the correct procedures.
Process maps lose value if they do not reflect current operations. Teams should schedule reviews at least once a year. They also need to update maps whenever major changes happen, such as new technology or shifts in business strategy. These updates ensure that process maps remain relevant and practical.
Tip: Scheduled reviews prevent outdated information from causing mistakes or confusion.
Stakeholder involvement plays a key role during reviews. Teams invite stakeholders to provide feedback and share their experiences. This input helps identify steps that need improvement or clarification. Continuous feedback from team members allows organizations to catch problems early and make necessary changes.
Teams use several strategies to keep process maps up to date:
Review process maps at least annually.
Update maps after significant changes, such as new technology or business strategy shifts.
Schedule regular meetings with stakeholders to discuss process accuracy.
Collect ongoing feedback from teams to spot areas needing updates.
Ensure maps always reflect current practices.
A table can help teams organize their review process:
Review Strategy | Purpose |
|---|---|
Annual review | Maintains relevance and accuracy |
Update after major changes | Reflects new technology or business shifts |
Stakeholder meetings | Gathers feedback and ensures completeness |
Continuous team feedback | Identifies issues and supports improvements |
Teams treat process maps as living documents. They make changes as needed and communicate updates to everyone involved. This approach keeps processes efficient and reduces the risk of errors.
Note: Regular reviews help organizations adapt quickly to changes and maintain high performance.
By following these practices, teams ensure their process maps remain valuable tools for guiding daily operations and supporting long-term goals.
Future Trends
New Technologies
In 2025, new technologies continue to shape how organizations approach Business Process Mapping. Several innovations stand out for their impact on workflow visualization and efficiency.
AI-powered visualization tools, such as ChatGPT and Mermaid, automate diagram creation. These tools help teams save time and reduce manual effort.
Non-linear process maps allow teams to capture complex workflows. This approach supports better visualization of automation and collaboration.
Data-driven decisions become easier with modern process maps. Real-time analytics help teams adapt quickly and improve workflow efficiency.
Delegation and multi-threading empower team members to document processes. This method helps organizations scale operations while maintaining quality.
Tip: Teams that adopt these technologies can respond faster to changes and improve overall productivity.
Digital Transformation
Digital transformation influences how organizations design and manage their processes. The following table highlights key ways digital tools change Business Process Mapping:
Influence of Digital Transformation on Business Process Mapping | Description |
|---|---|
Customer-Centric Processes | Organizations redesign workflows to enhance customer experience using digital tools. |
Change Management | Visual guides help employees understand new roles and responsibilities during transitions. |
Data-Driven Decision-Making | Process diagrams show how data flows, supporting informed choices. |
Continuous Improvement | Teams monitor digital solutions and adapt processes to meet business needs. |
Compliance | Digital mapping ensures organizations follow regulations and avoid risks. |
Teams use digital transformation to create more flexible and responsive workflows. They focus on customer needs and use data to guide improvements.
Continuous Improvement
Continuous improvement remains essential for organizations that want to stay competitive. Several proven methodologies help teams refine their processes:
Six Sigma provides a structured approach to problem-solving. Teams use it to eliminate defects and reduce variability.
Lean focuses on waste reduction and improving customer value. The 5S system helps optimize workspaces.
Value Stream Mapping (VSM) analyzes workflows to find inefficiencies and remove waste. Teams apply VSM in both manufacturing and service industries.
Kaizen encourages all employees to suggest small enhancements. This philosophy supports ongoing, incremental improvement.
Note: Teams that practice continuous improvement build a culture of learning and adaptability.
Organizations that combine new technologies, digital transformation, and continuous improvement create strong foundations for future success. They use Business Process Mapping to guide change and achieve better results.
Business Process Mapping gives teams and clients at systems the tools to improve workflows and reach goals. They follow clear steps, use modern platforms, and review processes often. Teams learn new skills and adapt to changes. Readers can start mapping today and see results.
For more information, they can reach out and begin their journey toward better business processes.
FAQ
What is the main goal of business process mapping?
Business process mapping helps teams visualize workflows. They use maps to find inefficiencies and improve productivity. The main goal is to make processes clear and easy to follow.
Which process mapping tool works best for beginners?
Lucidchart and Miro offer user-friendly interfaces. These platforms provide templates and drag-and-drop features. Beginners can create clear maps without advanced training.
How often should teams update process maps?
Teams should review process maps at least once a year. They also update maps after major changes, such as new technology or business strategies.
What symbols appear most often in process maps?
Common symbols include ovals for start/end, rectangles for steps, diamonds for decisions, and arrows for flow direction. These symbols help users understand each part of the process.
Can process mapping improve customer satisfaction?
Process mapping helps teams identify and fix problems. Improved workflows lead to faster service and fewer mistakes. Customers benefit from better experiences.
Is process mapping only useful for large companies?
Small businesses also gain value from process mapping. They use maps to streamline tasks, reduce errors, and support growth.
What is the difference between a flowchart and a swimlane diagram?
A flowchart shows the sequence of steps in a process. A swimlane diagram organizes steps by roles or departments, making responsibilities clear.
How does automation fit into process mapping?
Teams use automation to handle repetitive tasks. Automated processes save time and reduce errors. This allows employees to focus on important work.


