Unlocking Efficiency with Six Sigma Process Mapping

Six Sigma Process Mapping transforms Business Management by making weak points visible and actionable. Many organizations struggle with issues like cultural resistance, unreliable data, or the pressure for quick Sales results. Teams often find that improvements stall when they lack clear Knowledge of their processes. The positive impact appears across industries:
Industry | Example Company | Impact Achieved |
|---|---|---|
Automotive | Ford, Toyota, BMW | Reduced defect rates, optimized supply chain logistics, improved OEE |
Healthcare | Mayo Clinic, Mount Sinai | Reduced patient wait times, minimized medication errors |
Financial Services | Bank of America, American Express | Reduced transaction errors, expedited loan approvals |
Professionals can ask: Where do hidden inefficiencies slow things down, and how could mapping reveal new opportunities?
Key Takeaways
Six Sigma Process Mapping reveals inefficiencies in workflows, helping organizations identify and address weak points.
Using process maps allows teams to visualize every step, making it easier to spot delays and errors.
Implementing process mapping can lead to significant improvements in efficiency, with some organizations reporting up to 60% faster task completion.
Regularly reviewing and updating process maps ensures they remain relevant and effective, preventing confusion and inefficiencies.
Involving all stakeholders in the mapping process fosters collaboration and helps capture valuable insights.
Choosing the right mapping tool, such as flowcharts or SIPOC diagrams, is crucial for effectively visualizing processes.
Data-driven decision-making supported by process mapping leads to better resource utilization and higher returns on investment.
Integrating process mapping into daily routines promotes continuous improvement and helps teams quickly address issues.
Efficiency Gains

Process Improvement
Six Sigma process mapping drives measurable improvements for organizations by making every step in a workflow visible. Teams use these maps to spot delays, errors, and unnecessary steps. For example, Walmart improved supply chain and inventory management by mapping processes, which reduced overstocking and stockouts. Mayo Clinic streamlined patient care, decreasing wait times and boosting operational efficiency. These changes help systems and teams deliver better results for their clients.
Industry | Tool Used | Improvement Metric | Percent Improvement |
|---|---|---|---|
Manufacturing | Process Mapping | Production Efficiency | |
Healthcare | Value Stream Mapping, Control Charts | Patient Wait Times | 35% |
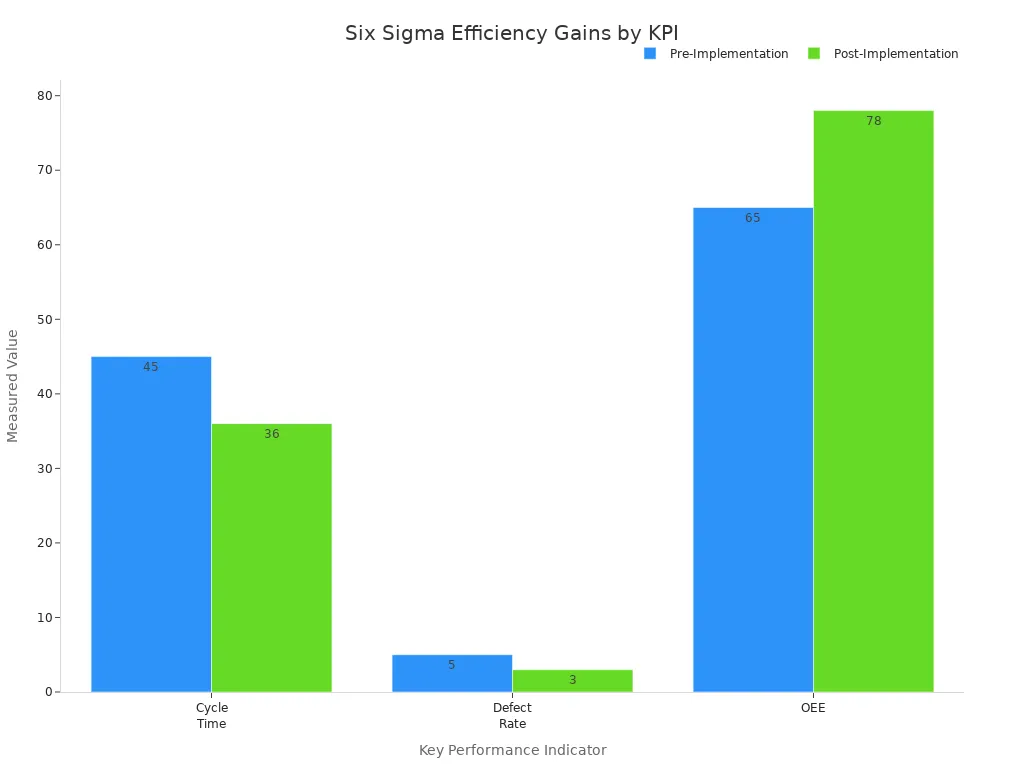
Teams often measure gains using key performance indicators (KPIs). The table below shows how Six Sigma mapping improves cycle time, defect rate, and overall equipment effectiveness (OEE):
KPI | Pre-Implementation | Post-Implementation | Improvement |
|---|---|---|---|
Cycle Time (minutes) | 45 | 36 | -20% |
Defect Rate (%) | 5 | 3 | -40% |
OEE (%) | 65 | 78 | +20% |
Waste Reduction
Six Sigma process mapping helps organizations cut waste by identifying sources of inefficiency. Teams in manufacturing, for instance, used the DMAIC approach to reduce waste in polypropylene bag production by 50%. Cost savings followed as they controlled process variation. These improvements benefit clients by lowering costs and increasing product quality.
Manufacturing plants saw significant cost savings after controlling process variation.
The DMAIC approach can be applied to similar operations for greater efficiency.
Waste reduction leads to more sustainable practices and better resource management.
Process Visibility
Process mapping gives teams and clients a clear view of how work flows through a system. This visibility allows managers to identify defects, bottlenecks, and inefficiencies. Real-time analytics and data-driven insights support faster, smarter decisions. When process operators review performance together, accountability and collaboration increase.
Teams use process maps to spot issues before they affect clients.
Data-driven insights enable proactive problem-solving.
Collaboration improves as everyone understands their role in the process.
Six Sigma process mapping empowers organizations to achieve efficiency gains by making processes transparent, reducing waste, and supporting continuous improvement. Systems, teams, and their clients benefit from better results, lower costs, and higher quality.
Six Sigma Process Mapping

Visualizing Processes
Six Sigma Process Mapping gives teams a clear picture of how work flows from start to finish. Teams use process maps to break down complex tasks into simple steps. This approach helps everyone see where problems or delays might occur. By using visual tools, teams can quickly spot bottlenecks, unnecessary steps, or areas that need improvement.
Method | Purpose |
|---|---|
Focuses on Suppliers, Inputs, Processes, Outputs, and Customers to outline the workflow. | |
Process Mapping | Documents and analyzes workflows through flowcharts and models. |
Value Stream Mapping | Shows each step in delivering a product or service, highlighting waste and inefficiency. |
Kanban | Uses a visual board to track progress and manage workflow. |
Teams often choose the method that best fits their project goals. For example, SIPOC diagrams help teams understand the big picture, while flowcharts provide detailed step-by-step views. These visualizations make it easier for clients and team members to understand how a process works and where changes can lead to better results.
Process mapping helps teams and clients see the entire workflow, making it easier to identify and fix problems.
Key Principles
Successful Six Sigma Process Mapping relies on several key principles. Teams must define the problem, measure current performance, analyze root causes, improve the process, and control the results. These principles guide teams through each stage of process improvement.
Key Principle | Description | Tools Used |
|---|---|---|
Define | Outline the problem and project goals. | DMAIC, SIPOC |
Measure | Collect data on current performance. | Control charts, Process mapping |
Analyze | Find the root causes of defects or delays. | Pareto charts, Fishbone diagrams |
Improve | Implement solutions to address root causes. | Brainstorming, Pilot testing |
Control | Maintain improvements over time. | Control plans, Monitoring systems |
Teams also focus on customer needs, leadership, motivating people, process awareness, continuous improvement, evidence-based choices, and relationship management. These principles help teams stay focused and make decisions that lead to lasting improvements.
Lean Six Sigma Role
Six Sigma Process Mapping plays a central role in Lean Six Sigma projects. It helps teams combine the strengths of both Lean and Six Sigma methods. Lean focuses on reducing waste, while Six Sigma aims to improve quality through data and analysis. By mapping processes, teams can see every step, find inefficiencies, and make targeted improvements.
Define: Teams clearly define the problem and set objectives.
Measure: They gather data on how the process currently works.
Analyze: Teams look for the root causes of problems or delays.
Improve: They put solutions in place to fix these issues.
Control: Teams set up measures to keep improvements in place.
Aspect | Six Sigma | Lean |
|---|---|---|
Focus | Quality improvement with data | Waste reduction |
Methodology | Value Stream Mapping and Lean tools | |
Tools | Statistical analysis | Visual management |
Project Duration | Longer (months) | Shorter (days) |
Training Approach | Phased with application | Workshops with immediate use |
Integration with BPM | Identifies process gaps | Optimizes process flow |
Improvement Strategy | Data-driven, statistical | Process-focused, waste elimination |
Process mapping supports both Lean and Six Sigma by making workflows visible. This visibility helps teams and clients work together to find and fix problems. As a result, organizations achieve better efficiency, higher quality, and more reliable results.
Process Mapping Benefits
Streamlining Steps
Organizations use process mapping to simplify workflows and remove unnecessary actions. Teams identify each step, then eliminate tasks that do not add value. This approach leads to faster task completion and lower costs. The following table shows how companies benefit from streamlining steps:
Evidence Type | Impact on Time/Cost Savings |
|---|---|
Task Completion Time Reduction | |
Productivity Increase | Up to 35% within the first year |
Operational Cost Reduction | 25-30% reduction in operational costs |
Error and Defect Reduction | 50% reduction in errors and defects |
Customer Satisfaction Improvement | 30% increase in satisfaction scores |
Customer Complaints Reduction | Up to 45% decrease in complaints |
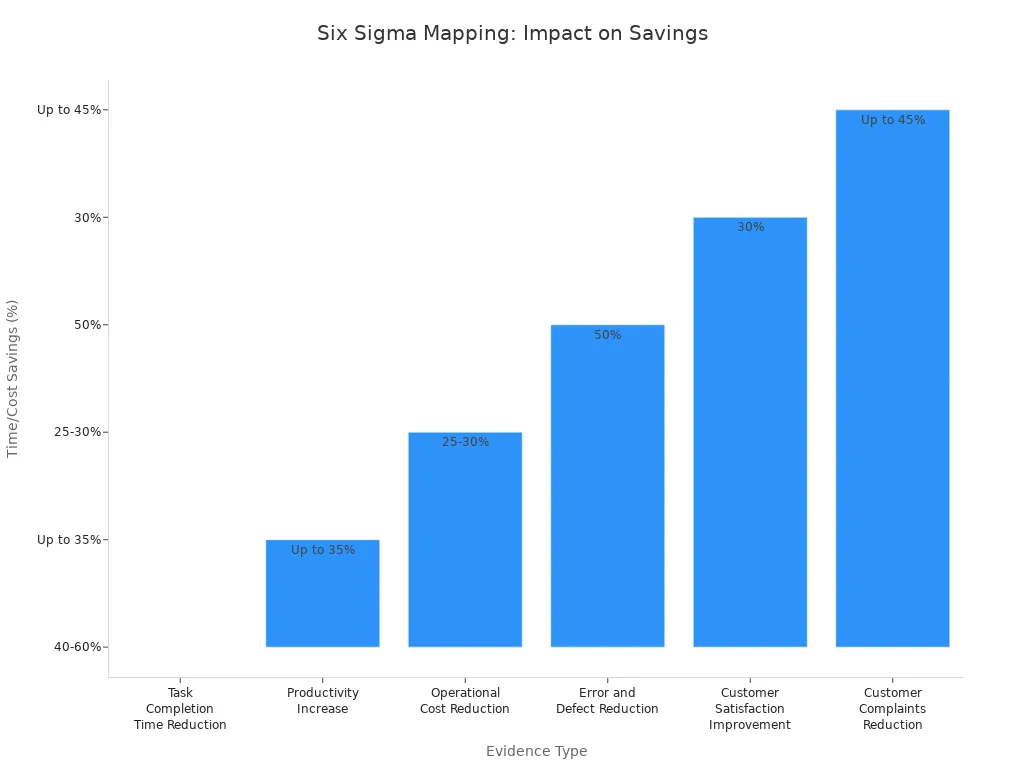
Teams that use Six Sigma Process Mapping often see measurable improvements. For example, companies report up to 60% faster task completion and a 30% drop in operational costs. These changes help clients receive products and services more quickly and with fewer errors.
Better Communication
Clear communication is essential for successful process improvement. Teams that use process maps share visual tools, such as charts and diagrams, to make complex information easy to understand. This practice helps everyone see trends and track progress. Improved communication also allows team members to discuss concerns and understand the benefits of changes.
Effective communication within teams helps address consumer needs and issues, leading to higher customer satisfaction.
Sharing visual tools makes data accessible, so team members can measure success.
Open communication helps manage resistance to change, as everyone can express concerns and learn about the benefits.
When teams communicate well, they work together more effectively. Clients benefit from consistent service and fewer misunderstandings.
Data-Driven Decisions
Process mapping supports data-driven decision-making by breaking down workflows into clear components. Teams analyze data from each step to find hidden inefficiencies and focus on improvements that deliver results. The SIPOC model helps teams organize information:
Component | Description |
|---|---|
Suppliers | Entities providing inputs to the process |
Inputs | Resources required for the process |
Process | The steps taken to transform inputs into outputs |
Outputs | The results produced by the process |
Customers | Recipients of the outputs |
Teams use systematic analysis to reveal inefficiencies and track improvements with key performance indicators. They follow a structured approach:
Assess potential impact on key metrics.
Evaluate resource requirements.
Consider implementation complexity.
Estimate expected return on investment.
Teams that rely on data make better choices, improve efficiency, and deliver higher value to clients.
Organizations that use these methods report lower defect rates, better resource utilization, and higher returns on investment. For example, GE saved over $12 billion in five years by applying these principles. Clients notice more consistent service and greater satisfaction.
Process Map Types
SIPOC Diagram
A SIPOC diagram gives teams a high-level view of a process. The acronym stands for Suppliers, Inputs, Process, Outputs, and Customers. Teams use SIPOC diagrams at the start of Six Sigma projects to outline the main elements of a workflow. This approach helps everyone understand the boundaries and key players in a process.
SIPOC diagrams break down complex workflows into five clear parts. This structure makes it easier to spot inefficiencies and gaps. Teams can quickly see who supplies the inputs, what resources they use, the steps involved, the outputs produced, and who receives the results. By mapping these elements, teams ensure that all critical factors are considered.
SIPOC diagrams improve communication and collaboration among stakeholders. They help teams identify missing or weak links in a process before moving to detailed analysis.
Value Stream Map
A Value Stream Map (VSM) focuses on the flow of materials and information needed to deliver a product or service. Teams use VSMs to see every step from start to finish, highlighting where value is added and where waste occurs. This type of map helps organizations improve efficiency from the customer’s perspective.
Hospitals use value stream mapping to find long wait times for diagnostic tests. By mapping the process, they streamline steps and improve patient satisfaction.
Organizations apply VSM to analyze data and measure inefficiencies. This helps them find the root causes of waste.
During the Define and Measure stages of Six Sigma’s DMAIC framework, VSMs reveal where problems and delays exist in the current process.
Value stream maps support data-driven decisions. Teams can use the insights to remove bottlenecks, reduce delays, and focus on activities that add value.
Swimlane Map
Swimlane maps, also called swimlane diagrams, organize process steps by department or individual. Each “lane” represents a team or function. This layout makes it easy to see who is responsible for each task.
Swimlane diagrams clarify responsibility. Each lane shows which department or person handles each step.
They improve communication by showing how different teams interact.
Teams can spot inefficiencies, such as redundant steps or unnecessary handoffs, by viewing the process across departments.
Swimlane maps provide a comprehensive view, making process analysis and optimization more effective.
Swimlane diagrams work well for complex processes that involve multiple teams. They help organizations streamline workflows and ensure accountability.
Purpose | |
|---|---|
SIPOC Diagrams | Provide a high-level overview of key process components and establish boundaries. |
Value Stream Maps | Focus on improving efficiency and value from the customer’s perspective. |
Swimlane Diagrams | Establish accountability and streamline communication in cross-functional processes. |
Choosing the right process map type depends on the project’s goals. SIPOC diagrams, value stream maps, and swimlane maps each offer unique benefits for process improvement.
Flowchart
Flowcharts serve as one of the most widely used tools in Six Sigma process mapping. They use simple shapes and arrows to show the sequence of steps in a process. Each shape represents a different type of action, such as a decision, a task, or the start and end of a process. This visual approach helps teams see the entire workflow at a glance.
A flowchart breaks down a process into clear, individual steps. This method makes it easier for team members to understand how each part connects. When teams use flowcharts, they can quickly spot where decisions happen and where problems might occur. The visual format supports better teamwork and faster problem-solving.
Flowcharts help teams move from confusion to clarity. They turn complex processes into easy-to-follow diagrams.
Key Benefits of Flowcharts in Six Sigma:
Flowcharts simplify complex processes by breaking them into smaller, manageable steps. This makes it easier to understand the logic behind each decision.
The visual format encourages collaboration. Team members can discuss each step and suggest improvements.
Flowcharts help teams identify bottlenecks and areas for optimization. This leads to more efficient workflows.
A typical flowchart uses these common symbols:
Symbol | Meaning |
|---|---|
Oval | Start or End |
Rectangle | Process Step |
Diamond | Decision Point |
Arrow | Direction of Flow |
Teams often use flowcharts during the early stages of a Six Sigma project. They map the current process to find where delays or errors happen. By reviewing the flowchart together, teams can agree on which steps add value and which do not.
How to Create an Effective Flowchart:
Define the process boundaries. Decide where the process starts and ends.
List all the steps in the process. Use simple language for each step.
Arrange the steps in order. Connect them with arrows to show the flow.
Use standard symbols for actions and decisions.
Review the flowchart with the team. Look for missing steps or unclear areas.
Tip: Keep flowcharts simple. Too many details can make the diagram hard to read.
Flowcharts support clear communication. They help everyone see the same process and understand their roles. When teams use flowcharts, they can make better decisions and improve efficiency. This tool remains a cornerstone of Six Sigma process mapping because it turns complex ideas into clear, actionable plans.
Mapping Steps
Define Scope
Defining the scope sets the foundation for a successful Six Sigma Process Mapping project. Teams begin by clarifying what they want to achieve and which process they plan to review. This step ensures everyone understands the objectives and boundaries. When teams define the scope, they manage expectations and align their goals with stakeholder needs. A clear scope also helps identify crucial milestones and deadlines, which supports effective time management.
A well-defined scope allows teams to spot risks early and create contingency plans. This proactive approach reduces disruptions and increases the chance of project success.
Key benefits of defining scope:
Clarity on project objectives
Alignment with stakeholder expectations
Early risk identification
Realistic scheduling and milestone setting
Gather Data
Teams gather data to understand how the current process works. They use several methods to collect accurate information:
Surveys help gather opinions and feedback from stakeholders.
Interviews provide deeper insights through structured questions.
Observations capture real-time data and reveal inefficiencies.
Historical Data Analysis uses existing records to spot trends and measure past performance.
Automated Systems collect and monitor data continuously.
Collecting data from multiple sources gives teams a complete view of the process. This information helps them identify pain points and areas for improvement.
Teams should involve the right people in data collection to ensure accuracy and completeness.
Select Tools
Selecting the right tools is essential for effective Six Sigma Process Mapping. Teams choose tools based on the complexity of the process and the goals of the project. Common tools include flowcharts, SIPOC diagrams, value stream maps, and swimlane diagrams. Each tool offers unique advantages for visualizing steps, responsibilities, and process flows.
Tool | Best Use Case |
|---|---|
Flowchart | Simple, linear processes |
SIPOC Diagram | High-level overview of process components |
Value Stream Map | Identifying waste and value-added activities |
Swimlane Diagram | Cross-functional processes with many teams |
Teams review the process and select the tool that best fits their needs. The right tool makes it easier to visualize the workflow and communicate findings to stakeholders.
Choosing the appropriate mapping tool helps teams create clear, actionable process maps.
Map Current State
Mapping the current state gives teams a clear and accurate picture of how a process works today. This step helps everyone understand the workflow before making any changes. Teams use different types of process maps to visualize and analyze each step.
Teams often choose Value Stream Maps, Control Charts, Swimlane Diagrams, or SIPOC Diagrams to capture the process.
Stakeholders participate in the mapping process to ensure everyone shares the same understanding.
Teams define the boundaries of the process. This means they agree on where the process starts and ends.
Teams should decide how they will use the process map. Some maps help with communication, while others support detailed analysis.
A clear process map shows each step, the people involved, and the flow of information or materials. Teams avoid confusion by setting clear boundaries. This approach ensures that everyone agrees on what the process includes and what it does not.
Best Practices for Mapping the Current State:
Decide the purpose of the process map, such as for communication or analysis.
Set clear boundaries for the process. All team members should agree on the start and end points.
Involve stakeholders to gather different perspectives and ensure accuracy.
Mapping the current state lays the foundation for effective analysis and improvement.
Analyze and Improve
After mapping the current state, teams analyze the process to find problems and opportunities for improvement. The visual documentation makes it easier to spot delays, bottlenecks, and steps that do not add value.
Benefit of Analysis | Description |
|---|---|
Visual Workflow | Teams see how work moves from one stage to the next. |
Identify Inefficiencies | Maps highlight where delays and waste occur. |
Targeted Improvements | Teams focus on the areas that will have the biggest impact. |
Teams use the process map to ask important questions. Where do delays happen? Which steps cause errors? Are there tasks that do not add value? By answering these questions, teams can suggest changes that improve efficiency and quality.
Teams often use brainstorming sessions to generate ideas for improvement. They test solutions on a small scale before making larger changes.
The analysis step helps teams make informed decisions. They use data from the process map to guide their actions and measure results.
Implement Changes
Once teams identify improvements, they put changes into action. This step turns ideas into real results. Teams use process mapping tools, such as Value Stream Mapping and SIPOC Maps, to guide their efforts.
Process mapping and Value Stream Mapping help teams find inefficiencies. These tools often lead to shorter turnaround times and fewer backlogs.
SIPOC Maps and Standard Work Combination Sheets give a complete view of the process. Teams use them to spot and remove steps that do not add value.
Many projects set clear goals, such as reducing pending cases by 8%, based on customer needs.
Six Sigma programs use a structured approach to improve processes. Teams focus on both efficiency and innovation. This helps organizations perform better and adapt to changes in the market.
Teams monitor the results of their changes. They track key metrics to make sure improvements last.
Implementing changes based on process mapping leads to better performance, higher quality, and greater customer satisfaction. Teams continue to review and refine processes to maintain these gains.
Common Mistakes
Overcomplicating Maps
Many teams fall into the trap of making process maps too complex. They add every detail, hoping to capture the entire workflow. This approach often leads to confusion. Team members may struggle to understand the map, which can slow down improvement efforts. Overly detailed maps can hide the most important steps and make it hard to see where problems exist.
Process maps should clarify, not complicate. When maps become too detailed, they can cause miscommunication and misinterpretation among team members. This confusion can prevent teams from making effective improvements.
Some common issues with overcomplicated maps include:
Confusion about the main steps in the process
Miscommunication between team members
Misinterpretation of process steps, which can lead to poor decisions
Teams should focus on the key steps and keep maps simple. A clear map helps everyone see the process and work together to improve it.
Ignoring Input
Successful process mapping depends on input from all stakeholders. When teams ignore feedback from employees, customers, or partners, they risk missing valuable insights. This mistake can lead to maps that do not reflect the real process or address actual needs.
Consequence | Description |
|---|---|
Misaligned Engagement Strategies | Strategies may not match stakeholder needs and expectations. |
Missed Collaboration Opportunities | Teams lose chances for valuable partnerships and insights. |
Stakeholders may push back against changes they did not help shape. | |
Reduced Employee Engagement | Employees may feel undervalued and become disengaged. |
Decreased Organizational Performance | Performance may drop due to ineffective strategies and lack of buy-in. |
Ignoring input can also increase resistance to change. Employees who feel left out may not support new processes. Teams may also miss out on collaboration opportunities, which can slow down progress. Inadequate change management can lead to project delays and higher costs.
Resistance to change grows when people do not understand the reasons behind it.
Employee engagement drops if their voices are not heard.
Poor change management can cause delays and cost overruns.
Teams should always seek feedback and involve stakeholders in the mapping process. This approach leads to better maps and smoother implementation.
Outdated Maps
Process maps must stay current to remain useful. When teams fail to update maps, they risk using information that no longer matches the real process. Outdated maps can cause confusion and inefficiency. Teams may waste time and resources following steps that are no longer relevant.
Evidence | Explanation |
|---|---|
This keeps maps relevant and effective, supporting Six Sigma success. | |
Outdated process maps can lead to confusion and inefficiencies | Confusion wastes effort and resources, undermining Six Sigma goals. |
Effective process mapping supports strategic decision-making | Without current maps, decisions may be misguided, affecting long-term success. |
Teams should review and update process maps regularly. This practice ensures that maps reflect the current state and support strategic decisions.
Keeping maps up to date helps teams avoid mistakes and maintain efficiency. It also supports long-term success by providing accurate information for decision-making.
Lack of Action
Many organizations invest time and resources into creating detailed process maps. However, some teams stop after mapping and never move forward with real changes. This lack of action can prevent any real improvement from taking place. Process maps only deliver value when teams use them to drive decisions and implement solutions.
Note: A process map is a tool, not the final goal. Teams must act on their findings to achieve results.
Why does lack of action happen?
Teams may feel overwhelmed by the problems they discover.
Leaders might not assign clear responsibilities for follow-up.
Some organizations lack a culture of accountability.
Teams may not have the resources or support to make changes.
When teams do not act, several negative outcomes can occur:
Consequence | Description |
|---|---|
Stagnant Performance | Processes stay the same, so inefficiencies remain. |
Wasted Effort | Time spent mapping does not lead to improvements. |
Low Morale | Teams feel discouraged when nothing changes. |
Missed Opportunities | Potential gains in quality or efficiency are lost. |
How can teams avoid this mistake?
Set Clear Action Plans: Teams should create a list of specific steps to address each issue found in the process map.
Assign Ownership: Every action item needs a responsible person or team. This ensures accountability.
Establish Deadlines: Setting target dates helps keep momentum and tracks progress.
Monitor Progress: Teams should review actions regularly and adjust as needed.
Celebrate Wins: Recognizing improvements, even small ones, keeps teams motivated.
Teams that move from mapping to action see real benefits. They reduce waste, improve quality, and boost customer satisfaction.
Tip: Teams can use a simple action log to track progress. For example:
Action Item | Owner | Due Date | Status |
|---|---|---|---|
Remove duplicate step | Operations | 05/10/2024 | Completed |
Update training guide | HR | 05/20/2024 | In Progress |
Automate data entry | IT | 06/01/2024 | Not Started |
Taking action turns process maps into powerful tools for change. Teams that follow through on their findings help their organizations grow and succeed. Process mapping is only the beginning—the real value comes from making improvements happen.
Best Practices
Regular Reviews
Teams that want to keep their process maps effective must review them regularly. Regular reviews help teams spot changes in workflows, technology, or business needs. These reviews also ensure that process maps stay accurate and useful.
Teams should schedule reviews at set intervals, such as every quarter or after major changes.
During each review, teams compare the current process map to real-world practices.
They update the map to reflect any new steps, removed tasks, or changes in responsibility.
Regular reviews prevent outdated maps from causing confusion or mistakes. Teams that review often can react quickly to problems and keep improving.
A simple review checklist can help:
Review Step | Purpose |
|---|---|
Compare map to real process | Find gaps or outdated steps |
Gather team feedback | Get input from all stakeholders |
Update documentation | Keep maps current and clear |
Communicate changes | Ensure everyone stays informed |
Team Training
Training helps teams use process mapping tools correctly. Well-trained teams create better maps and find more opportunities for improvement. Training also builds confidence and encourages team members to share ideas.
New team members should receive training on process mapping basics.
Experienced staff can benefit from advanced workshops or refresher courses.
Teams should practice mapping real processes during training sessions.
Training supports a culture of continuous improvement. When everyone understands the tools, teams work faster and make fewer mistakes.
Key training topics include:
How to choose the right mapping tool
How to involve stakeholders in mapping
How to analyze and improve mapped processes
A team that invests in training will see better results from its process improvement efforts.
Using Technology
Modern technology makes process mapping easier and more effective. Digital tools allow teams to create, edit, and share maps quickly. These tools also help teams track changes and store maps in one place.
Teams can use software to build flowcharts, SIPOC diagrams, and value stream maps.
Cloud-based tools let team members work together, even from different locations.
Automated alerts can remind teams when it is time to review or update a map.
Technology saves time and reduces errors. Teams that use digital tools can focus more on analysis and less on paperwork.
Popular features in process mapping software include:
Feature | Benefit |
|---|---|
Drag-and-drop design | Easy to build and edit maps |
Real-time collaboration | Teams work together online |
Version control | Track changes over time |
Integration with data | Use real process data |
Teams that use technology for process mapping can respond faster to changes and keep their maps up to date.
Daily Integration
Integrating process mapping into daily routines helps teams maintain efficiency and drive continuous improvement. Teams that use process maps every day can spot issues early and respond quickly. This habit turns process mapping from a one-time event into a powerful tool for ongoing success.
Why Daily Integration Matters
Teams that review and update process maps regularly can adapt to changes in workflows, technology, or customer needs. Daily integration ensures that process maps reflect real-world practices, not just ideal scenarios. When teams use process maps as part of their daily work, they build a culture of transparency and accountability.
Tip: Teams that make process mapping a habit find it easier to identify bottlenecks and fix problems before they grow.
How Teams Can Integrate Process Mapping Daily
Morning Stand-Ups: Teams can start each day by reviewing key process maps. This helps everyone understand their roles and priorities.
Visual Boards: Many teams use digital or physical boards to display process maps. These boards keep workflows visible and encourage team members to track progress.
Quick Updates: Teams should update process maps when they change a step or add a new task. Small, frequent updates keep maps accurate.
Problem-Solving Sessions: When issues arise, teams can use process maps to analyze the problem and find solutions together.
Performance Checks: Teams can compare daily results to the process map. This helps them see if they follow the best practices or need to adjust.
Benefits of Daily Integration
Benefit | Description |
|---|---|
Faster Problem Solving | Teams spot and fix issues quickly |
Better Communication | Everyone understands the workflow |
Higher Accountability | Team members know their responsibilities |
Continuous Improvement | Teams make small changes that add up over time |
Increased Efficiency | Workflows stay smooth and up to date |
Best Practices for Daily Integration
Assign a process owner who checks maps daily.
Encourage team members to suggest improvements.
Use simple language and clear visuals in all maps.
Celebrate small wins when teams improve a process.
Provide easy access to process maps for everyone.
Note: Teams that use process mapping every day create a workplace where improvement never stops.
Daily integration of process mapping supports a proactive approach. Teams that make this practice part of their routine see better results, fewer errors, and greater satisfaction for both employees and customers.
Six Sigma Process Mapping helps organizations find and fix inefficiencies. Teams see real results when they take action and keep their process maps up to date.
Start by reviewing one current process.
Share insights with your team.
Reach out to learn how systems and teams can support your goals.
Every improvement begins with a single step. Take that step today.
FAQ
What is Six Sigma process mapping?
Six Sigma process mapping shows each step in a workflow. Teams use it to find problems and improve how work gets done. This tool helps everyone see the process clearly.
How does process mapping help reduce waste?
Process mapping helps teams spot steps that do not add value. They can remove these steps to save time and resources. This leads to less waste and better efficiency.
Which tools work best for process mapping?
Teams often use flowcharts, SIPOC diagrams, value stream maps, and swimlane diagrams. Each tool fits different needs. For example, flowcharts show simple steps, while swimlane diagrams show who does each task.
How often should teams update process maps?
Teams should review and update process maps after big changes or at least every few months. Regular updates keep maps accurate and useful for everyone.
Who should take part in process mapping?
People from all parts of the process should join. This includes team members, managers, and sometimes customers. Their input helps create a complete and accurate map.
Can process mapping work for small businesses?
Yes, small businesses can use process mapping. It helps them find ways to work faster and avoid mistakes. Even simple maps can lead to big improvements.
What is the difference between a flowchart and a value stream map?
A flowchart shows each step in a process. A value stream map shows the flow of materials and information. Value stream maps help teams see where waste happens.
How do teams measure success after mapping a process?
Teams track key metrics like time, cost, and error rates. They compare results before and after making changes. This shows if the process improved.


