Unlocking the Power of Six Sigma Process Mapping
Imagine a Sales team struggling with delays in order processing. Team members often feel confused about who handles each step. Six Sigma Process Mapping offers a visual tool that brings clarity to complex workflows. In Business Management, this method helps teams see every step, spot waste, and improve quality. A process map gives everyone Knowledge about their roles and makes communication easier. The table below shows key benefits:
Benefit | Description |
|---|---|
Reduction of Variability | Visualizing the process helps identify and eliminate sources of variability, leading to consistent outcomes. |
Improvement of Quality | Understanding process flow aids in identifying and removing defects or non-value-adding activities. |
Facilitation of Communication | Process maps enhance stakeholder understanding and collaboration regarding process changes. |
Documentation and Standardization | Provides a documented process for training and future improvements, ensuring sustained quality. |
Six Sigma Process Mapping supports Lean Six Sigma by reducing waste and boosting quality across industries.
Key Takeaways
Six Sigma Process Mapping helps teams visualize every step in a process, making it easier to understand roles and improve communication.
Using process maps can reduce variability, leading to more consistent outcomes and higher quality products or services.
Identifying and eliminating waste is a key benefit of Six Sigma Process Mapping, which helps organizations operate more efficiently.
Standardized symbols in process maps create a common language, making it easier for everyone to understand and follow the workflow.
Regularly reviewing and updating process maps ensures they remain accurate and relevant as processes evolve.
Engaging stakeholders throughout the mapping process fosters collaboration and ensures all perspectives are considered.
Technology tools like Lucidchart and Microsoft Visio enhance process mapping by allowing real-time collaboration and easy updates.
Continuous improvement is essential; teams should use feedback to refine their process maps and sustain gains over time.
Six Sigma Process Mapping Overview
What Is Six Sigma Process Mapping
Six Sigma Process Mapping is a structured approach to visually represent every step in a business process. This method uses standardized symbols and diagrams to show how work flows from start to finish. Teams use process maps to understand each action, decision, and outcome within a process. Unlike traditional mapping, Six Sigma Process Mapping focuses on finding and removing waste, not just showing the steps.
The core components and steps involved in Six Sigma Process Mapping include:
Determine the process boundaries. Teams identify where the process starts and ends.
List all the steps in the process. Each step, along with its inputs and outputs, gets documented.
Place the steps in order. The sequence of actions becomes clear.
Utilize the right symbols. Standard symbols represent different actions, decisions, or documents.
Check your work. Teams review the map for accuracy and completeness.
Tip: Using the correct symbols and reviewing the process map with the team helps prevent errors and confusion.
Purpose and Benefits
The main purpose of Six Sigma Process Mapping is to make business processes clear and easy to understand. This clarity helps teams spot problems, improve quality, and reduce waste. Process maps also support training and standardization, making it easier for new team members to learn the workflow.
Recent industry surveys highlight several key benefits:
Benefit | Description |
|---|---|
Enhances visibility over business operations, allowing for better understanding and management. | |
Identification of Bottlenecks | Helps in spotting inefficiencies and areas that require improvement. |
Enables Lean Methodologies | Provides a clear picture to identify and eliminate redundant or complicated processes. |
Six Sigma Process Mapping stands out from traditional process mapping in several ways:
Six Sigma process mapping emphasizes waste reduction and continuous improvement.
Traditional process mapping focuses on visualizing inputs, actions, and outputs without a specific emphasis on waste.
Value stream maps are better suited for identifying and eliminating waste compared to traditional process maps.
Role in Lean Six Sigma
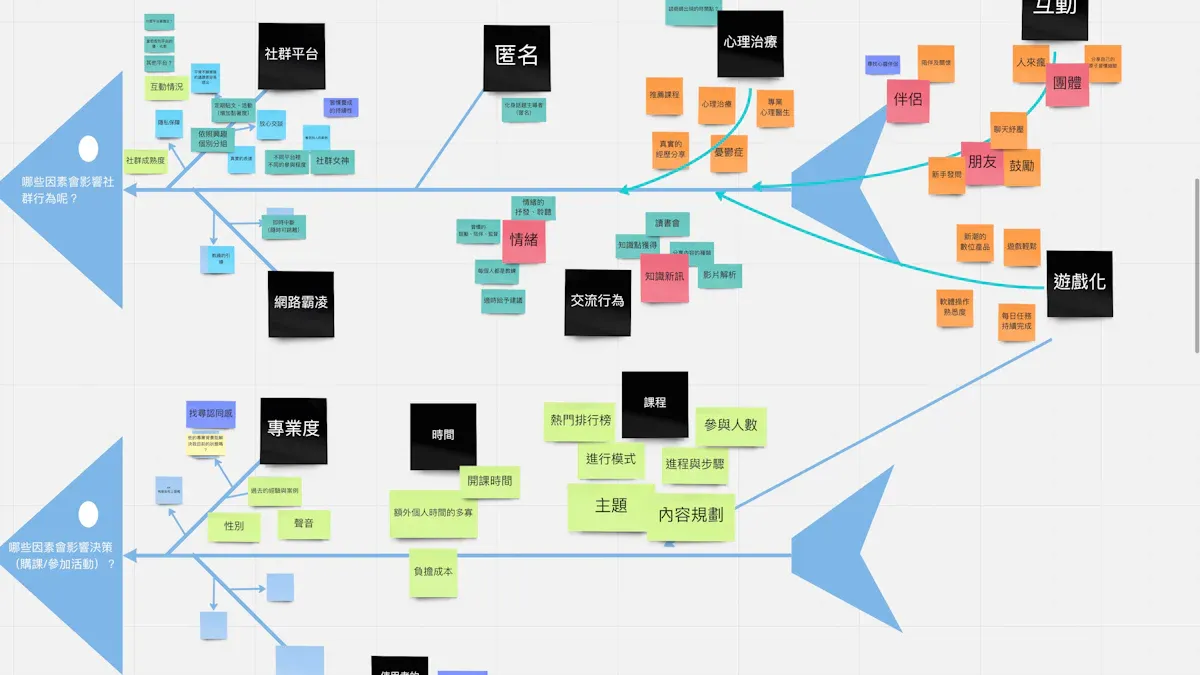
Six Sigma Process Mapping plays a vital role in Lean Six Sigma projects. It supports the DMAIC (Define, Measure, Analyze, Improve, Control) methodology by providing visual tools at each stage. For example, teams use high-level process maps like SIPOC diagrams during the Define phase. In the Measure phase, detailed process maps and value stream maps help track performance. During the Analyze phase, cause and effect diagrams and the 5 Why Analysis uncover root causes. Control charts help maintain improvements in the Control phase.
DMAIC Phase | Tools Used |
|---|---|
Define | |
Measure | Detailed Process Mapping, Value Stream Maps |
Analyze | Cause and Effect Diagrams, 5 Why Analysis |
Improve | N/A |
Control | Control Charts |
Six Sigma Process Mapping gives teams a clear view of their processes. This clarity supports Lean Six Sigma goals by making it easier to find waste, improve quality, and maintain control over changes.
Key Advantages
Efficiency Gains
Organizations often seek ways to improve speed and reduce delays. Six Sigma Process Mapping helps teams visualize each step, making it easier to spot slowdowns and unnecessary actions. When teams map their processes, they can identify areas where work piles up or where tasks take too long. Many companies have seen measurable improvements after using this approach.
Metric | Before Six Sigma | After Six Sigma | Improvement |
|---|---|---|---|
Defect Rate | X% | Y% | Reduction of Z% |
Cycle Time | A days | B days | Reduction of C days |
Cost Savings | $D | $E | Savings of $F |
A hospital reduced average discharge time by 30%, improving patient throughput and satisfaction.
GE reported significant reductions in defects and operational costs after Six Sigma implementation.
Ford streamlined its manufacturing processes, leading to enhanced efficiency.
Teams that use process mapping often see faster workflows and fewer delays. This leads to better use of resources and improved customer satisfaction.
Quality Improvement
Quality stands at the center of every successful business. Six Sigma Process Mapping allows teams to find errors and fix them before they become bigger problems. By tracking each step, teams can measure how well their process works and make changes that boost quality.
Metric | Description |
|---|---|
Defects Per Million Opportunities (DPMO) | Measures the probable error rate of a process or product, indicating efficiency and effectiveness. |
First Time Yield (FTY) | Calculates the percentage of items produced correctly the first time without rework. |
Rolled Throughput Yield (RTY) | Quantifies overall quality by considering defects and rework across all process steps. |
Process Capability Indices (Cp and Cpk) | Evaluates the process's ability to meet customer specifications. |
Sigma Level | Indicates how well a process meets customer requirements and compares performance across processes. |
Cost of Poor Quality (COPQ) | Measures the financial losses incurred from producing poor-quality products or services. |
Teams use these metrics to track progress and set goals for improvement. When quality rises, customers receive better products and services.
Waste Reduction
Waste can hide in many forms within a business process. Six Sigma Process Mapping helps teams find and remove waste, leading to leaner operations. Waste includes extra movement, waiting, making too much, or doing more work than needed.
Description | |
|---|---|
Motion | Unnecessary movement of people due to poor workstation layout, leading to productivity loss. |
Waiting | Wasted time when employees or machines are idle, often due to bottlenecks or upstream issues. |
Overproduction | Producing more than needed, leading to excess inventory and resource waste. |
Overprocessing | Performing more work than required by the customer, resulting in inefficiencies. |
Defects | Products that do not meet quality standards, necessitating rework and increasing costs. |
Skills | Underutilization of employee talents, leading to lost productivity and morale issues. |
By reducing waste, organizations save money and improve morale. Employees feel more engaged when their work adds value and their skills are used well.
Six Sigma Process Mapping gives teams the tools to work smarter, deliver higher quality, and cut out waste. These advantages help organizations stay competitive and meet customer needs.
Types of Process Maps
SIPOC Diagram
A SIPOC diagram gives teams a high-level overview of a process. This tool helps people see the big picture before diving into details. SIPOC stands for Suppliers, Inputs, Process, Outputs, and Customers. Each part plays a key role in understanding how work flows from start to finish.
High-level overview: SIPOC diagrams provide a simplified view of the process.
Key elements identification: They clearly define Suppliers, Inputs, Process, Outputs, and Customers.
Facilitates understanding: SIPOC diagrams help teams grasp and improve processes.
A SIPOC diagram works best at the start of a project. Teams use it to agree on what the process includes and who gets involved. This agreement helps avoid confusion later.
When to Use SIPOC
Teams often use SIPOC diagrams during the Define phase of a Six Sigma project. This tool works well when a process feels unclear or when new team members join. SIPOC diagrams also help when teams need to align on process boundaries or clarify who supplies inputs and who receives outputs. By using SIPOC early, teams set a strong foundation for deeper analysis.
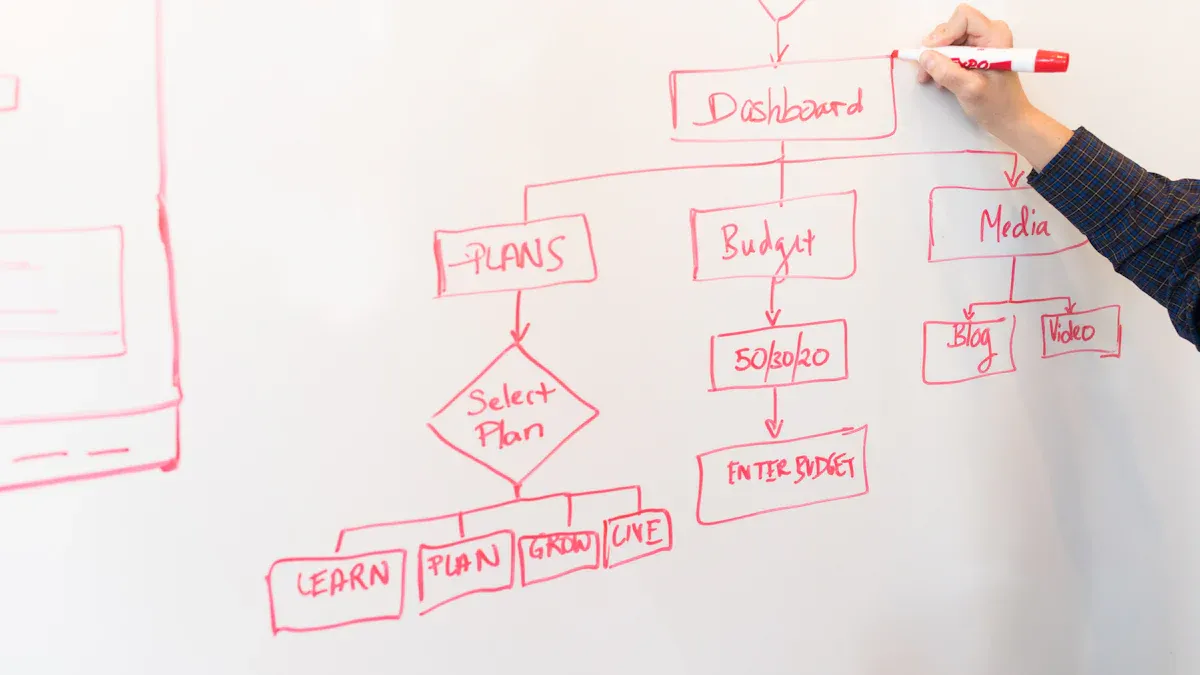
Flowchart
A flowchart maps out each step in a process using symbols and arrows. This visual tool shows the order of actions, decisions, and possible paths. Flowcharts make it easy for teams to see how work moves from one step to the next.
Flowcharts serve as a powerful tool in Six Sigma projects by visually mapping out processes. This visual format simplifies the understanding of the sequence of steps, decision points, and potential bottlenecks, which is essential for team collaboration and process optimization.
Once flowcharts are established, they act as a vital documentation tool, providing a clear and standardized language for team members to refer to processes. This clarity promotes better communication and helps identify areas for improvement.
Training team members to effectively use flowcharts not only enhances their understanding of processes but also empowers them to contribute creatively to continuous improvement efforts, fostering a culture of collaboration and innovation.
Best Use Cases
Flowcharts work best when teams need to:
Break down complex processes into simple steps.
Identify where errors or delays happen.
Train new employees on standard procedures.
Communicate process changes to different departments.
Teams often use flowcharts in the Measure and Analyze phases of Six Sigma projects. These diagrams help everyone see the same process and spot areas for improvement.
Value Stream Map
A value stream map (VSM) gives a detailed look at how value moves through a process. This map tracks every step, from raw materials to finished product. Teams use VSMs to find waste and improve flow.
Contribution to Process Improvement | |
|---|---|
Processing Steps | Helps evaluate each step in the workflow to identify and eliminate non-value-adding steps, streamlining operations. |
Customer Demand | Ensures production aligns with actual demand, avoiding waste from overproduction or under-delivery. |
Work in Progress (WIP) | Tracks current tasks to identify bottlenecks and improve flow, reducing task switching and enhancing predictability. |
First Pass Yield (FPY) | Measures quality and efficiency, reducing rework and freeing up capacity for new work, thus improving overall output. |
Identifying Bottlenecks
Teams use value stream maps to spot where work slows down or piles up. By tracking work in progress and first pass yield, teams can see which steps cause delays or create defects. This information helps teams focus their improvement efforts on the right areas, leading to faster and more reliable processes.
Standardized Symbols
Standardized symbols play a key role in Six Sigma process mapping. These symbols help teams create clear and consistent diagrams. When everyone uses the same symbols, process maps become easier to read and understand. This shared language supports better teamwork and reduces confusion.
Process maps often use a set of common symbols. Each symbol has a specific meaning. Teams rely on these symbols to show steps, decisions, and the flow of work. The table below lists the most widely used symbols in Six Sigma process mapping:
Symbol | Name | Description |
|---|---|---|
Oval | Terminator | Represents the start or end of a process. |
Rectangle | Process Step | Represents a task or activity in the workflow. |
Diamond | Decision Point | Shows where a decision must be made. |
Arrow | Flow Direction | Indicates the direction of the process. |
The oval symbol marks where a process begins or ends. Teams use this symbol to show clear boundaries. The rectangle stands for a process step. It shows a specific task or action. The diamond represents a decision point. At this step, the process can go in different directions based on a yes or no answer. The arrow shows the flow direction. It connects symbols and guides the reader through the process.
Using standardized symbols helps teams avoid misunderstandings. Everyone can follow the process map, even if they did not create it.
Teams often use these symbols in flowcharts, SIPOC diagrams, and value stream maps. Standardization makes it easier to train new team members. It also helps when sharing process maps with other departments. Consistent symbols save time during meetings and reviews.
Some teams add extra symbols for documents, delays, or data. However, the four symbols listed above form the foundation of most process maps. Teams should agree on which symbols to use before starting a new map.
Clear and simple symbols make process maps more effective. Teams can spot problems faster and suggest improvements with confidence. Standardized symbols support the main goals of Six Sigma: reducing waste, improving quality, and making processes easier to manage.
Creating a Six Sigma Process Map
Define Scope and Goals
Every successful process map starts with a clear understanding of what needs improvement. Teams must set boundaries and objectives before mapping begins. This step ensures everyone works toward the same outcome and avoids confusion later.
A structured approach helps teams define the scope and goals:
Determine the context and scope. Teams decide which part of the process to review and what they want to accomplish.
Identify and sequence the steps of the current process. Teams set clear start and end points and plan to represent each step visually.
Ask others to review the map for accuracy. Team members check the information to confirm it matches real operations.
Analyze the process map and single out pain points. Teams look for redundancies, delays, or unclear steps and make notes for improvement.
Optionally, create a new process map showing the ideal state. Teams visualize how the process should work in the best scenario.
Tip: Teams should avoid making the scope too broad. Focusing on a specific process or department leads to better results.
Identify Process Steps
After setting the scope and goals, teams list every step in the process. Each action, decision, or handoff must appear in the correct order. This step-by-step breakdown helps teams see how work moves from start to finish.
Teams often use brainstorming sessions or interviews to gather information. They ask questions like, "What happens first?" and "Who is responsible for this step?" This approach ensures no important actions get missed.
A clear list of steps makes it easier to spot gaps or overlaps. Teams should use simple language and avoid technical jargon. This practice helps everyone understand the process, even those new to the team.
Common Pitfall: Skipping steps or combining actions can lead to confusion. Teams should document each step separately for accuracy.
Document Inputs and Outputs
A complete process map shows not only the steps but also the resources and results at each stage. Teams must identify what goes into the process and what comes out. This information helps teams understand how work flows and where problems might occur.
The table below outlines the main components to document:
Component | Description |
|---|---|
Suppliers | Entities that provide inputs to the process. |
Inputs | Resources required to achieve the intended outputs. |
Process | The series of actions or steps taken to transform inputs into outputs. |
Outputs | The final products or results of the process. |
Customers | The end-users or recipients of the outputs. |
Teams often use value stream maps to analyze the flow of materials and information. These maps use standard symbols to show work streams and information paths. Activities are labeled as value-adding or not, based on the customer's perspective.
Note: Teams should check that every input has a clear supplier and every output has a defined customer. This practice ensures the process map is complete and accurate.
Six Sigma Process Mapping relies on careful documentation of each step, input, and output. This attention to detail helps teams find areas for improvement and supports long-term success.
Use Standardized Symbols
Teams improve process map clarity by using standardized symbols. These symbols help everyone understand each step and decision in the workflow. When teams use the same symbols, they avoid confusion and make the map easier to read.
Best practices for using standardized symbols include:
Keep it simple. Start with basic symbols like ovals for start/end, rectangles for process steps, diamonds for decisions, and arrows for flow direction. Add advanced symbols only when needed. Too many symbols can make the map hard to follow.
Consistency is key. Use the same symbols throughout the map. This helps everyone interpret the diagram the same way.
Collaborate in real time. Teams can use digital tools with real-time features to build maps together. This ensures everyone’s input is included.
Automate when possible. Some diagramming tools offer automation. These features save time and reduce mistakes.
Integrate with other tools. Teams often use process maps with other project management or documentation tools. Integration keeps maps accessible and up to date.
Tip: Before starting, teams should agree on which symbols to use. A legend or key on the map helps new members understand the symbols quickly.
Gather Team Feedback
Team feedback strengthens the accuracy and usefulness of a process map. Each member brings a unique view of the process. Gathering feedback ensures the map reflects real operations and not just one person’s perspective.
Ways to gather effective feedback include:
Encourage open conversation after presenting the map. This helps gather initial thoughts and questions.
Separate strategic feedback from personal opinions. This keeps the discussion focused on process improvement.
Map the process together. Collaborative mapping helps team members see their roles and responsibilities.
Use virtual whiteboards for real-time feedback and brainstorming. These tools allow everyone to contribute ideas.
Facilitate one-on-one discussions for more personal feedback. Some team members may prefer to share thoughts privately.
Leverage visual collaboration apps for feedback outside of meetings. Asynchronous tools let people review and comment at their own pace.
Use messaging apps for quick, informal communication.
Send anonymous surveys or polls. This option helps those who feel uncomfortable speaking up in groups.
Note: After collecting feedback, summarize the main points. Share how the team will use the feedback and follow up on any changes made.
Refine and Validate
Refining and validating the process map ensures it accurately represents the workflow and supports improvement goals. Teams review the map, make adjustments, and use validation techniques to check for errors or risks.
Two effective validation techniques include:
Validation Technique | Description |
|---|---|
Assesses risks involved with a solution and helps refine it before implementation. | |
Mistake-proofing (Poka-Yoke) | Ensures that the proposed solution does not create additional defects or errors. |
Teams use FMEA to identify where the process might fail and to plan improvements. Mistake-proofing helps design steps that prevent errors from happening. Both methods help teams build reliable and efficient processes.
Teams should revisit the process map after making changes. Regular reviews keep the map accurate and useful as the process evolves.
Real-World Applications

Manufacturing Example
Manufacturing companies often use Six Sigma process mapping to improve efficiency and quality. Teams in these organizations map out every step in their production lines. This approach helps them find delays, reduce waste, and boost output. The table below shows how different manufacturers have used process mapping to achieve measurable results:
Organization | Application Area | Measurable Results and Improvements |
|---|---|---|
Aerospace Parts Manufacturer | Machining cycle time | 46% reduction in cycle time; 80% decrease in process variation; increased productivity and profitability. |
Catalent Pharma Solutions | Pharmaceutical production | Reduced defect rates; improved batch maintenance; cost reduction. |
Baxter Manufacturing | Environmental performance | Reduced waste; doubled revenue; significant water and cost savings. |
Texas Department of Licensing and Regulation (TDLR) | Records management | Reduced storage costs; streamlined processes; robust records management. |
Ford Motors | Automotive manufacturing | $2.19 billion waste reduction; $1 billion cost savings; 5-point increase in customer satisfaction. |
Teams at Ford Motors, for example, mapped their automotive manufacturing process. They identified waste and made changes that saved $2.19 billion. The company also saw a $1 billion reduction in costs and higher customer satisfaction.
Service Industry Example
Service organizations also benefit from Six Sigma process mapping. Teams in these industries use process maps to improve customer service, reduce costs, and streamline operations. The table below highlights several areas where service teams have seen positive outcomes:
Application Area | Documented Outcomes |
|---|---|
Service Organizations | Improved customer satisfaction, increased profit margins |
Call Centers | Reduced costs and lower turnover |
Surgical Suites | Enhanced process efficiency and quality |
Government Offices | Streamlined operations and reduced waste |
Procurement | Cost savings and improved service delivery |
R&D | Faster project completion and better resource allocation |
For example, call centers mapped their workflows to find steps that caused delays. After making improvements, they reduced costs and saw lower employee turnover. Surgical suites used process mapping to enhance efficiency and quality, leading to better patient outcomes.
Business Impact
Six Sigma process mapping delivers clear business benefits across industries. Organizations report lower costs, faster delivery, and higher quality. Some of the most common impacts include:
Cost reduction through better resource use and fewer errors.
Lead time reduction by streamlining steps and removing bottlenecks.
Waste reduction, with some companies cutting waste by 30%.
Improved cycle time, with up to 20% faster completion of key processes.
Fewer customer complaints and product returns, leading to better service quality.
Teams that use Six Sigma process mapping often see measurable improvements in both efficiency and quality. These results help organizations stay competitive and deliver more value to their customers.
Best Practices
Stakeholder Engagement
Successful Six Sigma process mapping depends on strong stakeholder engagement. Teams and systems must work together to identify everyone who influences or is affected by the process. Stakeholder mapping should continue throughout the project, not just at the beginning. Teams use actionable maps to guide engagement and track changes in stakeholder interest and influence. This approach helps teams respond quickly to new challenges.
Teams identify and analyze stakeholders to assess their influence and interest.
They categorize and prioritize stakeholders, then develop specific engagement strategies.
High influence and high interest stakeholders often require tailored approaches, such as one-on-one meetings.
Teams use updated maps to monitor historical data and adjust strategies as needed.
Stakeholder mapping remains an ongoing process, adding value during discussions, planning, and reporting.
Collaboration between systems and teams ensures that stakeholder feedback shapes process maps. Teams use digital tools to share updates and gather input, making engagement more effective.
Clarity and Simplicity
Clear and simple process maps help teams work together and understand each step. When teams use visual tools, they create a shared language that connects departments and roles. This common understanding supports better collaboration and faster problem-solving.
Contribution to Success | Description |
|---|---|
Communication Tool | Process maps help teams create a common understanding of workflows. |
Visual Simplification | Maps make complex processes easy to follow for everyone, from front-line workers to executives. |
Shared Language | Teams use maps to clarify roles and show how departments interact. |
Bottleneck Identification | Maps reveal inefficiencies, redundancies, and non-value-adding activities. |
Teams and systems collaborate by reviewing maps together and making changes based on feedback. Simple symbols and clear steps make it easier for everyone to participate. Teams avoid technical jargon and focus on what each person needs to know.
Tip: Teams should keep process maps straightforward. Clarity helps everyone spot problems and suggest improvements.
Continuous Improvement
Continuous improvement keeps Six Sigma process maps effective over time. Teams use process maps to visualize workflows and identify inefficiencies. They standardize best practices to align everyone’s efforts. This approach fosters a culture of ongoing enhancement and responsiveness to change.
Teams monitor performance to maintain gains from improvements.
Systems support regular audits and continuous training to sustain benefits.
Teams update process maps as workflows evolve, ensuring accuracy and relevance.
Collaboration between teams and systems helps organizations respond quickly to new challenges.
Continuous improvement relies on teamwork and strong systems. Teams share ideas, review results, and adjust processes together. Systems provide tools for tracking changes and measuring progress. This partnership helps organizations stay competitive and deliver better results.
Note: Regular reviews and updates keep process maps useful. Teams should schedule audits and training to support ongoing improvement.
Technology Tools
Technology tools play a vital role in modern Six Sigma process mapping. These tools help teams visualize processes, assign roles, and clarify rules. By using digital solutions, organizations can create clear maps that outline every step. This approach makes it easier to spot problems and find areas for improvement.
Many software platforms support process mapping. Some popular options include Microsoft Visio, Lucidchart, Minitab Workspace, and IBM Blueworks Live. Each tool offers unique features that help teams build, share, and update process maps quickly.
Tool Name | Key Features | Best For |
|---|---|---|
Microsoft Visio | Drag-and-drop shapes, templates, integration | Detailed flowcharts, SIPOC |
Lucidchart | Cloud-based, real-time collaboration, templates | Team mapping, remote work |
Minitab Workspace | Statistical analysis, DMAIC templates, mapping | Data-driven Six Sigma projects |
IBM Blueworks Live | Process discovery, automation, cloud access | Large teams, process automation |
Teams use these tools to create diagrams like SIPOC, flowcharts, and value stream maps. SIPOC diagrams, for example, help define process boundaries and identify key steps, inputs, and outputs. This high-level view supports the Define phase in the DMAIC cycle. Digital tools make it easy to adjust SIPOC diagrams as teams gather more information.
Digital process mapping tools allow teams to collaborate in real time. They can add comments, suggest changes, and update maps together. This teamwork leads to better understanding and faster problem-solving.
Most technology tools offer features such as drag-and-drop design, built-in templates, and automatic formatting. These features save time and reduce errors. Many platforms also support cloud storage, so teams can access process maps from anywhere.
Some advanced tools include analytics and reporting. These features help teams measure process performance and track improvements over time. For example, Minitab Workspace combines mapping with statistical analysis, making it easier to link process changes to results.
When choosing a technology tool, teams should consider their needs. Small teams may prefer simple, user-friendly platforms. Large organizations might need tools with automation and integration features.
Tip: Start with a tool that matches the team's skill level. As the team grows more comfortable, they can explore advanced features.
Technology tools make Six Sigma process mapping more efficient and effective. They help teams visualize responsibilities, identify root causes, and find opportunities for improvement. By using the right tools, organizations can support continuous improvement and achieve better results.
Six Sigma Process Mapping brings many benefits to organizations:
Improved quality and leaner operating costs
Easier identification of problems and areas for improvement
Better understanding of the entire process
The main steps include:
Identify all process steps
Sequence the steps
Use symbols correctly
Review the map
Begin improvements
Teams can take these next steps to drive results:
Validate the process map with feedback
Implement and monitor progress
Sustain success through regular review
Continuous improvement and ongoing feedback help organizations achieve lasting gains and foster a culture of excellence.
Evidence Type | Description |
|---|---|
Team Collaboration | Huddles and boards promote teamwork and communication. |
Standardized Mapping | Visual tools help teams spot inefficiencies and streamline processes. |
Six Sigma Process Mapping works best when teams collaborate and use standardized methods. Readers can reach out to learn how systems and teams support similar success.
FAQ
What is the main goal of Six Sigma process mapping?
Six Sigma process mapping aims to make business processes clear. Teams use it to find waste, improve quality, and create a shared understanding of workflows.
How does process mapping support Lean Six Sigma projects?
Process mapping helps teams visualize each step. This makes it easier to spot problems, reduce waste, and track improvements during Lean Six Sigma projects.
Which industries benefit most from Six Sigma process mapping?
Manufacturing, healthcare, finance, and service industries all benefit. Any organization that wants to improve efficiency and quality can use process mapping.
What are the most common types of process maps?
Teams often use SIPOC diagrams, flowcharts, and value stream maps. Each type serves a different purpose in understanding and improving processes.
Why should teams use standardized symbols in process maps?
Standardized symbols make process maps easy to read. Teams can quickly understand steps, decisions, and flows, which supports better communication and training.
How often should teams update their process maps?
Teams should review and update process maps regularly. Changes in workflow, technology, or team structure often require updates to keep maps accurate.
Can technology tools improve process mapping?
Yes! Technology tools like Lucidchart or Microsoft Visio help teams create, share, and update process maps quickly. These tools also support real-time collaboration.
What is a common mistake to avoid in process mapping?
Teams sometimes skip steps or combine actions. This can cause confusion. Each step should appear separately to ensure accuracy and clarity.


