3 easy ways Business Process Mapping boosts your workflow today
Business Process Mapping empowers teams to unlock rapid improvements in workflow. Teams gain instant clarity about their operations, which leads to fewer mistakes and faster project completion. Clients and customers notice these changes quickly because employees understand their roles and responsibilities. Many organizations experience a 20% to 30% boost in operational efficiency and up to 25% reduction in costs after taking simple optimization steps. The table below shows the most immediate benefits:
Benefit | Description |
|---|---|
Improved Visibility | Teams see every part of their workflow for better understanding. |
Enhanced Accountability | Employees recognize their role in reaching company goals. |
Simplified Workflows | Complex tasks become easier, leading to more efficient operations. |
Key Takeaways
Business Process Mapping improves workflow clarity, leading to fewer mistakes and faster project completion.
Teams can boost operational efficiency by 20% to 30% and reduce costs by up to 25% through simple optimization steps.
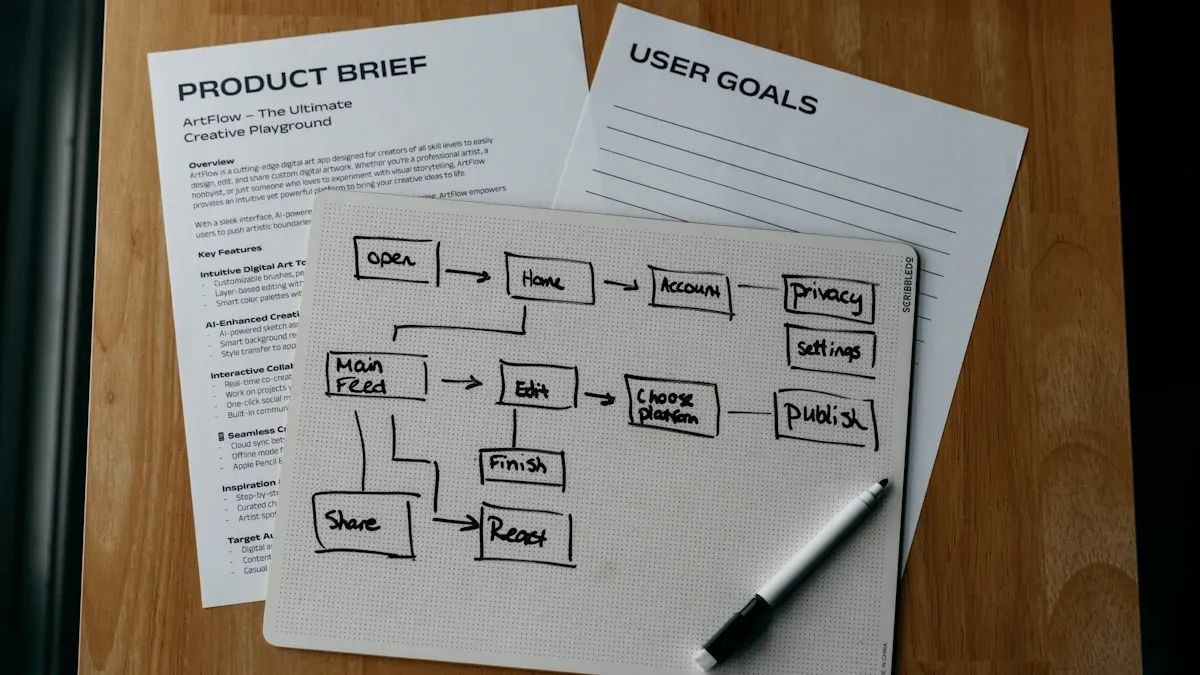
Using visual tools like swimlane maps clarifies roles and responsibilities, reducing confusion and enhancing teamwork.
Identifying and addressing bottlenecks with process maps helps streamline operations and improve overall efficiency.
Involving team members in the mapping process fosters collaboration and ensures accurate representation of workflows.
Regularly reviewing and updating process maps keeps communication strong and workflows efficient.
Celebrating quick wins motivates teams and builds trust in the process of continuous improvement.
Choosing the right tools and templates simplifies the mapping process, making it accessible for beginners.
Clarify Roles Fast
Reveal Who Does What
Reduce Confusion
Teams often struggle when roles remain unclear. Business Process Mapping helps everyone see their responsibilities in a visual format. Swimlane maps show who handles each step, making onboarding easier for new employees and introducing teams to clients. When each person knows their tasks, misunderstandings decrease. The following table highlights how mapping roles impacts productivity:
Evidence Description | Impact on Team Productivity |
|---|---|
Swimlane maps clarify process roles and responsibilities. | Valuable for onboarding new employees or introducing teams to clients. |
Business process mapping gives teams a clear visual guide. | This clarity helps everyone understand their roles, reduces misunderstandings, and supports continuous improvement. |
Mapping out workflows helps everyone understand their part in the bigger picture. | This shared vision leads to better teamwork and more effective campaigns. |
Process maps break down silos between departments. | Encourages open discussion and problem-solving across the organization. |
Business process mapping clarifies roles and responsibilities within a process. | Helps to identify overlapping tasks and potential miscommunications. |
Mapping also uncovers redundant tasks. | Teams can eliminate duplicate work, which saves time and resources, leading to smoother workflows and less confusion. |
Clearly defining roles with tools like RACI charts prevents tasks from falling through the cracks. This approach leads to better collaboration. Andrew Tischler notes that role clarity helps retain talent and reduces friction between teams. Employees feel more engaged when they understand their responsibilities.
Make Accountability Clear
Mapping roles clarifies responsibilities across the organization. Teams can prevent issues caused by unclear ownership. High-quality data supports informed decisions, which enhances accountability. Improvements often appear quickly after mapping roles. Teams notice fewer missed deadlines and more consistent results.
Map Roles Today
Simple Tools
Teams can use simple tools to start mapping roles. Flowcharts and swimlane diagrams provide clear visuals. Business process mapping software offers structured approaches, allowing users to document processes, create flowcharts, and analyze data. The most effective tools include features like notifications and real-time collaboration. The table below shows important criteria for choosing a tool:
Criteria | Description |
|---|---|
Total Cost of Ownership | Analyze upfront and ongoing costs, prioritize competitive fees and predictable pricing. |
Ease of Use | Look for intuitive interfaces and low-code options to facilitate adoption by non-technical users. |
Scalability | Ensure the tool can grow with the business, allowing for unlimited workflows and users. |
Integration Capabilities | Seek platforms with pre-built integrations and open API for seamless connectivity. |
Teams should spot dependencies and note decision points. These steps help everyone understand the workflow and identify areas for improvement.
Team Involvement
Team involvement is essential for successful mapping. Teams should map the current process, analyze for gaps, set priorities based on impact, and implement changes. Open discussion encourages problem-solving and helps break down silos between departments. When everyone participates, the process becomes more accurate and effective.
Tip: Involve key team members early. Their input ensures the map reflects real tasks and responsibilities.
Business Process Mapping gives teams a shared vision. This clarity leads to better teamwork, faster onboarding, and improved accountability.
Remove Workflow Bottlenecks

Spot Inefficiencies
Common Bottlenecks
Teams often encounter bottlenecks that slow down progress and reduce efficiency. Business Process Mapping helps identify these issues quickly. The most frequent bottlenecks include:
Workload imbalances among employees.
Tasks return for rework due to errors or quality concerns.
Approval processes become cumbersome, especially when key individuals are unavailable.
Performer-based bottlenecks occur when tasks wait for specific approvals.
System-based bottlenecks arise from technology issues, such as slow software.
Long wait times for information or products stall tasks.
Backlogged work overwhelms some teams while others remain underutilized.
These bottlenecks disrupt workflow and cause delays. Teams benefit from visualizing these problems, which makes them easier to address.
Make Problems Visible
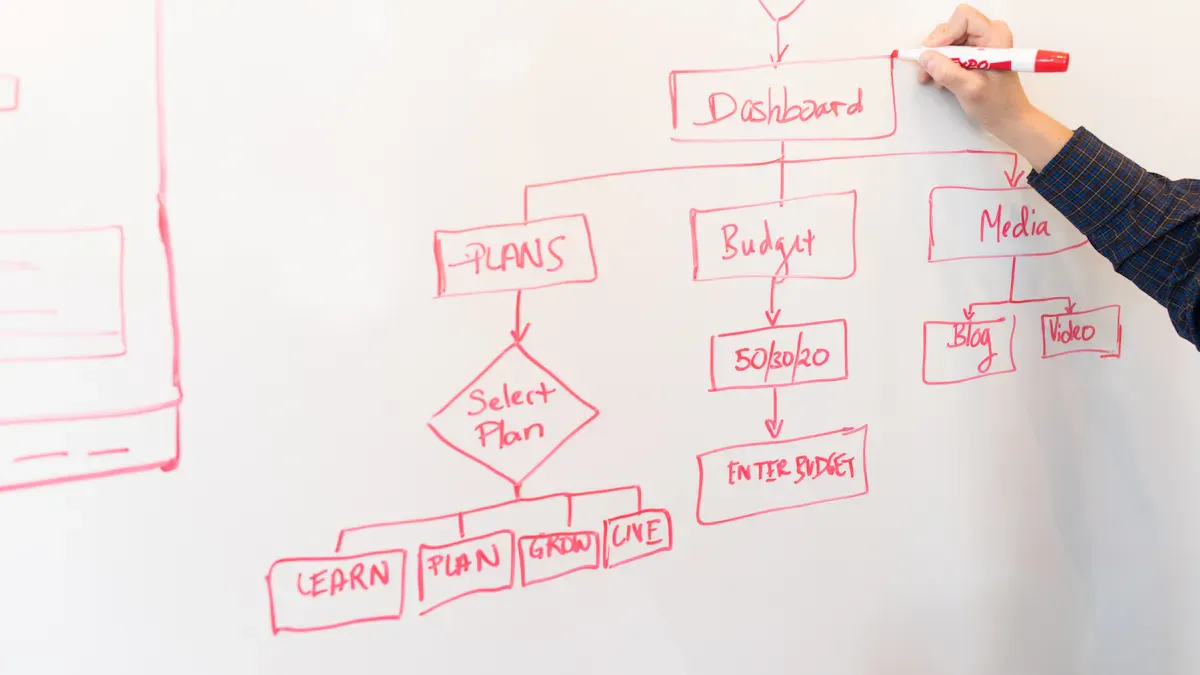
Business Process Mapping allows teams to see where tasks pile up, break down, or get missed. Visual maps highlight areas that need improvement. Teams use these maps to standardize workflows and reduce waste. Clearer communication and faster decision-making follow. The table below shows how mapping makes problems visible:
Problem Area | How Mapping Helps |
|---|---|
Task pile-ups | Identifies where work stalls |
Rework due to errors | Highlights quality issues |
Approval delays | Pinpoints slow decision points |
System slowdowns | Reveals technology bottlenecks |
Note: Teams gain a better understanding of their workflow when they visualize bottlenecks. This insight leads to faster solutions.
Fix Bottlenecks Now
Quick Solutions
Teams can use process maps to spot and address bottlenecks that block progress. Corrective measures include streamlining processes, reallocating resources, or redesigning workflows. Teams analyze mapped processes to find inefficiencies and areas for improvement. They reassess mapping strategies to ensure enough detail exists to identify and correct issues. Ongoing monitoring and review help sustain improvements.
Identify and address bottlenecks using process maps.
Streamline processes to remove unnecessary steps.
Reallocate resources to balance workloads.
Redesign workflows for better efficiency.
Monitor and review processes regularly.
Business Process Mapping enhances operational efficiency by identifying inefficiencies and streamlining processes. Organizations can reduce operational inefficiencies by up to 30%. Teams visualize workflows, spot bottlenecks, and implement targeted actions to eliminate delays.
Track Improvements
Teams track improvements by monitoring workflow changes. They measure how quickly bottlenecks resolve and how much efficiency increases. Regular reviews help maintain progress and ensure sustained results. Teams share quick wins to motivate others and build momentum.
Tip: Use visual maps in meetings to discuss progress and highlight areas that need attention.
Streamline Communication
Visualize Handoffs
Prevent Errors
Teams often lose valuable time when tasks move from one person to another without clear direction. Handoffs represent the transfer of responsibility for a task, process, or activity from one group or individual to another. In business settings, these moments can create confusion if not managed well. Business Process Mapping highlights each handoff point, making it easy to see where tasks or information change hands. This visual approach helps teams recognize where errors might occur. When everyone sees the exact moment a task moves to a new owner, mistakes decrease and accountability improves. Handoffs become clear, so teams avoid missed steps and reduce the risk of duplicated work.
Improve Collaboration
Visualizing handoffs also strengthens collaboration. When teams map out where responsibilities shift, they understand how their work connects. This shared view encourages open discussion and helps break down silos. Teams see how their actions affect others, which leads to better cooperation. Some benefits of this approach include:
Business Process Mapping provides a shared view of workflows, reducing confusion and clarifying roles.
It encourages measurable goal setting and progress tracking, enhancing teamwork.
Regular reviews of mapped processes strengthen communication and support continuous improvement.
Process maps clarify individual responsibilities, helping team members understand their tasks and expectations.
They break down silos, showing how individual work connects with the broader team efforts.
Clear communication paths are established, reducing miscommunication and confusion.
Boost Team Communication
Use Maps in Meetings
Teams can use process maps during meetings to improve communication. Visual tools help everyone understand their roles and how different processes connect. When teams review these maps together, misunderstandings decrease. Visual representations make it easier to explain complex workflows. Swimlane maps, for example, show who is responsible for each task at every stage. This clarity keeps everyone on the same page and supports better decision-making.
Process maps provide a visual representation that helps team members understand their roles.
They reduce misunderstandings by clarifying how different processes interconnect.
Visual tools facilitate better communication and create a shared understanding among team members.
Sharing process maps keeps teams aligned and on the same page.
Visual tools simplify the explanation of roles and responsibilities.
Swimlane maps specifically clarify who is responsible for each task at different stages.
Tip: Bring process maps to team meetings to quickly identify gaps and discuss improvements.
Set Clear Handoffs
Setting clear handoffs ensures that tasks move smoothly between team members. Best practices for defining handoffs in process maps include:
Best Practice | Description |
|---|---|
Use active voice | Ensures clarity in communication within the process map. |
Avoid dead ends | Prevents confusion and maintains flow in the process. |
Make handoffs explicit | Clearly defines transitions between different roles or departments. |
Keep the flow readable | Enhances understanding and usability of the process map. |
Engaging stakeholders in the mapping process provides valuable insights. Their input helps create accurate and practical maps that reflect real business operations. Teams should regularly review and update process maps as operations evolve. Testing these maps in real-world scenarios helps identify any gaps or inefficiencies that need attention.
Note: Clear handoffs and regular updates keep communication strong and workflows efficient.
Getting Started with Business Process Mapping
Choose a Process
Selecting the right process to map sets the stage for success. Teams should focus on processes that have the most impact on daily operations. High-impact processes often involve many people or steps, and they can cause delays if not managed well.
Prioritize Impact
Teams can use these criteria to choose which process to map first:
Consider the variety of process maps available for different needs.
Check if templates can be customized for the process.
Look for tools that are easy to use.
Make sure support and training are available.
Ensure the tool integrates with other systems.
Choose tools that allow multiple users to collaborate.
Confirm that user permissions can be controlled.
By focusing on these points, teams can select a process that will deliver quick and visible improvements.
Involve Key People
Involving the right people increases the chances of a successful mapping project. Stakeholders bring valuable insights and help identify gaps in the workflow. Teams should use stakeholder mapping to understand roles and relationships. This approach ensures that everyone’s needs are addressed.
Evidence | Explanation |
|---|---|
Stakeholder Mapping | Identifies and analyzes roles and relationships, ensuring stakeholder needs are addressed. |
Effective Stakeholder Management | Fosters positive relationships, increasing the chances of successful projects and long-term objectives. |
Tailored Communication Strategies | Helps organizations gain support and cooperation by addressing stakeholder interests and concerns. |
Tip: Teams should invite key people to workshops or meetings when mapping processes. Their input leads to more accurate and useful maps.
Tools and Templates
Choosing the right tools and templates makes Business Process Mapping easier for beginners. Many free options exist, and simple templates help teams get started quickly.
Free Options
Popular free tools for process mapping include:
Microsoft Visio, a widely used tool for flowcharts and process maps.
Lucidchart, a web-based application for visual collaboration.
Diagrams.net, a free design tool for flexible diagram creation.
Gliffy, a cloud-based app for various diagram types.
Cacoo, web-based software for drawing diagrams.
SmartDraw, a collaborative tool for business visuals.
These tools help teams visualize workflows and share maps easily.
Keep It Simple
Simple templates help beginners understand complex tasks. They make it easier to see each step in a process and reduce confusion. Clear templates improve teamwork and help everyone stay on the same page.
They help beginners visualize complex workflows.
Better visualization leads to improved teamwork and less confusion.
Note: Teams should start with basic templates and add details as they gain experience. Keeping things simple helps everyone learn and participate.
Overcome Challenges
Business process mapping offers many benefits, but organizations often face obstacles during implementation. Teams may encounter resistance, unclear objectives, or overly complex maps. Addressing these challenges helps ensure successful adoption and lasting improvements.
Handle Resistance
Resistance to change is a common barrier. Employees may worry about new systems or fear job loss. Teams can also struggle with poor communication or lack of resources. The table below highlights frequent challenges organizations face:
Challenge | Description |
|---|---|
Resistance to Change | Employees may resist changes to established workflows. |
Lack of Clear Objectives | Without defined goals, mapping efforts can lose direction. |
Inadequate Resources | Limited funding, time, or staff can slow progress. |
Poor Communication | Misunderstandings can hinder stakeholder support. |
Complexity in Processes | Overly complex processes can block improvements. |
Inadequate Training | Employees may struggle without proper guidance on new tools. |
Siloed Departments | Restricted information flow can reduce coordination across teams. |
Get Team Buy-In
Teams can overcome resistance by involving employees early and often. Leaders should raise awareness about the purpose of process mapping. They can unite technical and people aspects by addressing both operational needs and employee concerns. Training programs help employees adapt to new workflows. Ongoing support within daily tasks builds confidence. Measuring impact and sharing quick wins reinforces the value of new processes. Leadership plays a key role in communicating the benefits and aligning process mapping with company goals.
Effective strategies for gaining buy-in include:
Raise awareness about the change and its purpose.
Involve employees in the mapping process.
Offer hands-on training that matches real tasks.
Provide ongoing support.
Measure impact and highlight wins.
Ensure leadership sponsors the change.
Tip: Transparent communication and recognizing employee concerns foster trust and reduce resistance.
Make Mapping Engaging
Teams can make mapping engaging by encouraging participation. Involving employees in workshops or meetings helps them feel valued. Leaders should explain how process mapping supports company objectives. Recognizing contributions and celebrating small wins boosts morale. When employees see their input reflected in the final map, they become more invested in the outcome.
Avoid Overcomplication
Overly complex process maps can confuse teams and slow progress. Simple, clear maps work best for most organizations.
Keep Maps Simple
Teams should break down complex processes into manageable steps. Using consistent symbols and notation prevents confusion. Stripping out irrelevant information keeps maps focused on what matters. Applying a leveled process architecture, such as the Perigon Method, can help maintain clarity.
Best practices for simple process maps:
Break processes into smaller, manageable parts.
Use clear and consistent symbols.
Remove unnecessary details.
Review maps regularly to ensure they stay relevant.
Note: Simple maps are easier to understand, update, and use for continuous improvement.
By addressing resistance and keeping maps simple, organizations can overcome common challenges and unlock the full benefits of business process mapping.
Measure Results
Track Improvements
What to Measure
Teams and systems need clear metrics to see the impact of business process mapping. Key performance indicators (KPIs) help track progress and show where improvements happen. The table below lists common KPIs that organizations use:
KPI Category | KPI Name | Description |
|---|---|---|
Process Efficiency | Cycle time | Time to complete a process from start to finish. |
Throughput | Rate of output for products or services. | |
Utilization | Percentage of time resources are used. | |
Quality | Defect rate | Number of errors in products or services. |
Customer satisfaction | Scores from surveys or feedback. | |
Cost | Total cost of ownership | All costs linked to a product or service. |
Employee Engagement | Turnover rate | How often employees leave the organization. |
Teams at systems and teams often focus on cycle time and defect rate to measure how quickly and accurately work gets done. For example, Alpha Services, a mid-sized professional services firm, reduced onboarding time by 45%, cut errors by 70%, and raised client satisfaction by 30 points after mapping their processes.
Share Quick Wins
Sharing early results motivates teams and builds trust in the process. Many organizations see fast improvements. For instance, 21% of companies save 10% or more after mapping their processes. Productivity often rises by 20-30%, and operational costs drop by 15-25%. The table below shows the impact:
Statistic | Impact |
|---|---|
21% of companies save 10% or more | Significant financial savings |
20-30% productivity improvement | Higher operational efficiency |
15-25% cost reduction | Resource optimization and cost savings |
Teams should highlight these wins in meetings and reports. This practice encourages others to support process mapping.
Build Momentum
Celebrate Success
Celebrating success helps teams stay engaged. Leaders at systems and teams can recognize achievements by sharing results in team meetings or company updates. Many organizations report strong financial returns. For example, 55% of organizations see returns between $100,000 and $500,000 per project. Teams also achieve a 20-50% increase in process efficiency by reducing cycle times.
Tip: Use small celebrations, like shout-outs or team lunches, to keep morale high.
Plan Next Steps
After early wins, teams should plan for ongoing improvement. The process often follows three stages:
Stage | Key Activities |
|---|---|
Discover | Documentation, data collection, process validation |
Analyze | Resource allocation, validation testing, process analysis |
Improve | Monitor outcomes, adjust, refine, improve maturity |
Teams should set clear, achievable goals. SMART goals—Specific, Measurable, Achievable, Relevant, Time-bound—work best. Leaders need to communicate the vision often to keep everyone aligned. Every change can affect many parts of the organization. Planning for ripple effects helps avoid problems and supports long-term success.
Note: Teams that measure results and celebrate progress build lasting momentum for continuous improvement.
Business Process Mapping transforms workflow in three key ways:
Teams visualize each step to streamline operations.
They improve performance by removing bottlenecks.
They enhance customer satisfaction with faster, error-free service.
Teams see immediate benefits, such as smarter decisions and reduced costs.
Ready for quick wins? Reach out to us to learn more or discover how systems and teams can support your journey.
Example Phrase | |
|---|---|
Inline Text CTA | Want more insights? Download the full report. |
FAQ
What is the main goal of business process mapping?
Business process mapping helps teams see each step in a workflow. They use maps to find problems and improve how work gets done. This leads to better results and less confusion.
Who should participate in process mapping?
Teams should include people who do the work every day. Leaders and key staff members also help. Their input makes the map accurate and useful.
How often should teams update process maps?
Teams should review process maps after big changes or at least once a year. Regular updates keep maps helpful and accurate.
What tools work best for beginners?
Many teams start with free tools like Lucidchart, Diagrams.net, or Microsoft Visio. These tools offer simple templates and easy sharing options.
Can small businesses use process mapping?
Small businesses benefit from process mapping. They can use simple diagrams to improve teamwork and reduce mistakes. No large budget is needed.
How does process mapping improve communication?
Process maps show who does each task. Teams use these visuals to talk about problems and share ideas. This leads to fewer errors and better teamwork.
What is a bottleneck in a process?
A bottleneck is a step that slows down the whole process. Teams use maps to spot these slow points and fix them for faster results.
How can teams measure success after mapping?
Teams track things like time saved, fewer mistakes, and happier customers. They use these results to show progress and plan next steps.


