How to Apply Six Sigma Methodology for Business Success

Six Sigma Methodology transforms business performance by delivering measurable gains in quality and efficiency. Many organizations face issues such as operational inefficiencies, rising costs, and limited resources. The following table highlights how leading companies have benefited:
Company | Cost Reduction (%) | Annual Savings ($) |
|---|---|---|
GE | Nearly $1 billion | |
Motorola | N/A | $17 billion over a decade |
Honeywell | N/A | Exceeding $600 million |
By reducing defects and focusing on systems that improve customer satisfaction, organizations can achieve remarkable results.
Key Takeaways
Six Sigma improves business performance by reducing defects and increasing efficiency.
The DMAIC framework helps teams fix existing processes, while DMADV is for designing new ones.
Focus on customer needs to set goals and measure success effectively.
Use data-driven decisions to identify problems and create lasting solutions.
Regularly track performance with control charts to maintain improvements over time.
Involve all employees in the process to build support and reduce resistance to change.
Select projects that align with business goals for maximum impact and measurable results.
Create a culture of continuous improvement to adapt quickly and sustain gains.
Six Sigma Methodology Overview
What Is Six Sigma?
Six Sigma Methodology stands out as a disciplined approach for improving quality and efficiency in business processes. Companies use this method to reduce errors and achieve measurable results. Unlike other quality improvement methods, Six Sigma Methodology relies on a rigorous statistical approach. Teams use data and analysis to minimize defects and control variation. This focus on measurable outcomes sets it apart from methods that depend on intuition or observation. Six Sigma aims for a very low defect rate—just 3.4 defects per million opportunities. This high standard helps organizations deliver consistent quality and meet customer expectations.
Key characteristics of Six Sigma include:
A data-driven approach to decision-making
Commitment to continuous quality improvement
Use of structured methodologies for process optimization
DMAIC vs. DMADV
Six Sigma Methodology uses two main frameworks: DMAIC and DMADV. Each framework serves a different purpose in business improvement.
Framework | When It’s Used | Purpose |
|---|---|---|
DMAIC | Reduce variation, defects, and waste | |
DMADV | Designing a new process or product | Build quality into the design from the start |
DMAIC stands for Define, Measure, Analyze, Improve, and Control. Teams use DMAIC to fix problems in current processes. They define the problem, measure data, analyze root causes, improve the process, and control the results to prevent future issues.
DMADV stands for Define, Measure, Analyze, Design, and Verify. This framework helps teams create new processes or products. They define goals, measure quality characteristics, analyze data, design improvements, and verify that the new process meets requirements.
Six Key Points of Six Sigma
Six Sigma Methodology rests on six key points that guide every project:
Customer Focus: Teams identify what customers need and expect. They use this information to set goals and measure success.
Clear Process Definition: Every process must be clearly defined. This helps teams understand each step and find areas for improvement.
Measuring Performance: Teams collect data to measure how well a process works. Accurate data supports better decisions.
Root Cause Analysis: Teams use statistical tools to find the real reasons for problems. This approach leads to lasting solutions.
Data-Driven Improvement: All changes rely on facts and analysis, not guesses. Teams test solutions and measure results.
Process Control: After making improvements, teams set up controls to keep processes stable and prevent problems from returning.
Note: Six Sigma Methodology’s structured approach and focus on data help organizations achieve consistent, high-quality results. This method supports both ongoing improvement and the design of new, reliable processes.
Why Six Sigma Matters
Business Benefits
Six Sigma Methodology delivers clear advantages for organizations that want to improve performance. Companies often see cost savings and higher profits when they use this approach. The methodology helps teams identify and remove wasteful activities. This leads to lower operational costs and less rework. Many organizations report cost savings of 15-25% in targeted processes during the first year. Manufacturing companies often save between $150,000 and $300,000 per project.
Some well-known companies have seen these results:
GE improved product quality and customer satisfaction, which increased profits.
Motorola, Ford, Amazon, and Bank of America reduced defects and improved cycle times. These changes led to higher productivity and stronger customer loyalty.
Electronics manufacturers optimized production lines, which reduced scrap materials and improved efficiency.
Teams that use Six Sigma Methodology can scale these improvements across many processes, creating a large impact on the bottom line.
Customer Focus
Six Sigma Methodology puts the customer at the center of every project. Teams use data to understand what customers want and need. They define customer requirements and measure how well current processes meet those needs. The DMAIC framework helps teams make changes that match customer preferences.
Organizations that use this approach often see customer satisfaction scores rise by 15-30% within two years. This improvement comes from fewer defects and faster delivery times. In the food production industry, for example, teams use Six Sigma tools to standardize ingredient measurements and cooking times. This ensures every batch tastes the same, which builds trust and loyalty among customers.
Six Sigma tools help organizations adapt to changing customer needs.
Teams use data-driven insights to improve products and services.
Improvements focus on what matters most to customers.
Real-World Impact
Systems and teams that adopt Six Sigma Methodology achieve measurable business success. Clients at systems and teams have reported better process control, fewer errors, and more consistent results. These improvements lead to higher profits and happier customers.
Area | Measurable Impact |
|---|---|
Cost Savings | 15-25% in targeted processes |
Annual Project ROI | $150,000 - $300,000 per project |
Customer Satisfaction |
Six Sigma Methodology gives organizations the tools to solve real problems and deliver lasting results.
Core Principles of Six Sigma
Defect Reduction
Defect reduction stands as a central goal in Six Sigma Methodology. Teams strive to deliver products and services that meet or exceed customer expectations. They follow several fundamental principles to achieve this:
Focus on the customer. Teams listen to customer needs and set clear targets for quality.
Use data-driven decision making. Teams rely on facts and statistical analysis instead of guesses.
Improve processes. Teams identify defects, remove them, and work to make processes better.
Involve employees. Workers at all levels participate in finding and fixing problems.
Secure management commitment. Leaders support the goals and provide resources for improvement.
Teams use these principles to reduce errors and deliver consistent results. They measure defects, analyze root causes, and apply solutions that prevent problems from returning. This approach helps organizations build trust with customers and improve their reputation.
Teams that focus on defect reduction create reliable products and services. They build loyalty and encourage repeat business.
Minimizing Variation
Minimizing variation helps organizations maintain high quality and predictable outcomes. Teams use several statistical methods to control variation in business processes:
Control charts track process data over time. Teams spot unusual issues before they affect quality.
Capability analysis checks if a process meets customer expectations and quality standards.
Poka-Yoke devices prevent mistakes at the source. These simple tools stop errors before they happen.
Visual controls use signals or indicators. Workers detect and fix process problems right away.
Standardized work creates clear, step-by-step procedures. Teams reduce errors and keep processes stable.
Teams apply these methods to keep processes consistent. They monitor data, adjust procedures, and respond quickly to changes. This focus on minimizing variation leads to fewer defects and higher customer satisfaction.
Data-Driven Decisions
Six Sigma Methodology relies on data-driven decisions to improve process outcomes. Teams collect and analyze data to guide their actions. This approach shifts decision-making from intuition to evidence-based strategies.
Benefit | Description |
|---|---|
Teams use objective data analysis instead of relying on intuition. | |
Faster decision-making | Data enables quicker choices and actions. |
Increased efficiency | Teams identify waste and streamline operations. |
Enhanced customer satisfaction | Process improvements align with customer needs. |
Manufacturing companies use Statistical Process Control charts to monitor processes and correct deviations. Hospitals analyze patient satisfaction surveys to find improvement areas and address root causes. Marketing teams conduct A/B testing to evaluate campaign effectiveness and select strategies with higher conversion rates.
Teams that use data-driven decisions achieve predictable outcomes and measurable improvements.
The Pareto Principle (80/20 Rule)
The Pareto Principle, often called the 80/20 rule, plays a key role in Six Sigma projects. This principle states that about 80% of effects come from 20% of causes. Teams use this idea to focus their efforts where they will have the greatest impact. For example, a business might find that 80% of customer complaints come from just 20% of its products or services. By identifying and addressing these critical few causes, teams can solve most of the problems with less effort.
Six Sigma teams often use Pareto charts to apply this principle. A Pareto chart is a bar graph that shows the frequency or size of problems in descending order. The tallest bars on the left represent the most significant issues. The chart also includes a line that shows the cumulative percentage of the total effect. This visual tool helps teams see which problems contribute the most to defects or errors.
Teams can quickly spot the biggest sources of trouble by looking at a Pareto chart. They do not waste time on minor issues that have little effect on the outcome.
Here is how the Pareto Principle guides improvement in Six Sigma projects:
Data Collection: Teams gather data on defects, errors, or complaints.
Chart Creation: They organize the data and create a Pareto chart.
Problem Identification: The chart highlights the top causes that lead to most problems.
Prioritization: Teams focus on fixing these key causes first.
Improvement: They implement solutions and measure the results.
A simple example can help explain this process. Imagine a call center receives 1,000 customer complaints in a month. After sorting the complaints, the team finds that 800 of them relate to just two issues: long wait times and unclear billing statements. The team creates a Pareto chart to show this distribution. By focusing on these two main causes, the call center can reduce most complaints and improve customer satisfaction.
The Pareto Principle helps organizations use their resources wisely. Teams do not try to fix every small problem at once. Instead, they target the few issues that cause the most trouble. This approach leads to faster results and greater efficiency.
The 80/20 rule encourages teams to work smarter, not harder. By solving the biggest problems first, organizations see measurable improvements in quality and performance.
DMAIC Process Steps
Define
Problem Identification
The Define phase sets the foundation for a successful Six Sigma project. Teams start by identifying the main problem that needs attention. They create a project charter to establish the project’s purpose and direction. This document outlines why the project matters and what the team hopes to achieve. Writing clear problem and goal statements helps everyone understand the issue and the desired outcome. Teams also define the boundaries of the project, which helps manage expectations and resources.
Gathering the Voice of the Customer (VOC) is a key activity. Teams listen to customers to learn what they need and expect. This information guides the project’s goals and priorities. Building a high-level process map, such as a SIPOC diagram (Suppliers, Inputs, Process, Outputs, Customers), gives a visual overview of the process and its stakeholders.
Activity | Contribution to Project Success |
|---|---|
Creating the project charter | Establishes the project's purpose and direction. |
Writing problem and goal statements | Clarifies what needs to be addressed and the desired outcome. |
Defining project boundaries (scope) | Helps in managing expectations and resources effectively. |
Gathering Voice of the Customer (VOC) insights | Ensures that customer needs are prioritized in the project. |
Provides a visual overview of the process and its stakeholders. |
A strong Define phase gives the team a clear path forward and ensures that everyone works toward the same goal.
Stakeholder Involvement
Stakeholder involvement plays a critical role in the Define phase. Teams identify everyone who has an interest in the project, including customers, employees, and managers. They communicate with these stakeholders to gather input and set expectations. Early involvement helps build support and reduces resistance to change. Teams use meetings, surveys, and interviews to collect feedback and keep stakeholders informed.
When stakeholders feel included, they are more likely to support the project and help drive success.
Measure
Data Collection
The Measure phase focuses on understanding the current process. Teams collect data to see how the process performs today. They start by establishing clear project goals for measurement. This step ensures that everyone knows what they aim to achieve. Teams identify key process metrics, such as cycle time, defect rate, or customer wait time. These metrics show where problems may exist.
Gathering enough data is important. Teams make sure the data is both sufficient and representative. This approach leads to accurate analysis and reliable results. Teams often use check sheets, tally charts, or digital tools to record data.
Key Metrics
Selecting the right metrics helps teams measure performance effectively. Teams choose metrics that matter most to the process and the customer. They use statistical tools, such as control charts and histograms, to assess the data. These tools help teams spot trends, patterns, and areas for improvement.
Best Practice | Description |
|---|---|
Define what you aim to achieve in the Measure phase. | |
Identify key process metrics | Determine which metrics are essential for measuring performance. |
Gather sufficient and representative data | Ensure the data collected is adequate for accurate analysis. |
Utilize statistical tools | Employ tools like control charts and histograms for effective assessment. |
Accurate measurement gives teams the facts they need to make smart decisions in the next phase.
Analyze
Root Cause Tools
The Analyze phase helps teams find the real reasons behind process problems. Teams use several tools and techniques to uncover root causes:
Cause-and-effect diagrams (also called fishbone or Ishikawa diagrams) help teams visually map possible causes. They organize causes into categories like materials, methods, measurements, environment, people, and machines.
The 5 Whys method encourages teams to ask "Why?" multiple times. This approach digs deeper into the problem and reveals the root cause.
Brainstorming sessions and the Nominal Group Technique allow teams to generate many ideas. These methods ensure that all possible causes are considered.
Using these tools, teams avoid guessing and focus on facts.
Statistical Analysis
Statistical analysis confirms which causes have the biggest impact on the problem. Teams use methods such as hypothesis testing (T-Tests, ANOVA), correlation and regression analysis, and process capability analysis. These tools show if a cause is truly linked to the problem or if it happened by chance. Design of Experiments (DOE) helps teams test changes and see what works best.
Teams that use both root cause tools and statistical analysis can solve problems more effectively and create lasting improvements.
Improve
Solution Generation
Teams move to the Improve phase after they identify the root causes of problems. They focus on creating and testing solutions that address these causes. Teams use brainstorming sessions to generate a wide range of ideas. They encourage every member to share suggestions, which leads to creative and practical solutions. After collecting ideas, teams evaluate each one for effectiveness and feasibility.
Teams often conduct pilots or controlled experiments to test the best solutions. These small-scale tests help them see if the solution works before making big changes. They select the most promising solution based on test results. Teams also perform risk assessments to find any possible issues with the new solution. This step helps them avoid problems during full implementation.
The table below shows common activities in this phase:
Activity | Description |
|---|---|
Brainstorming and evaluating improvement ideas | Generating a wide range of potential solutions to address identified issues. |
Conducting pilots or controlled experiments | Testing solutions in a controlled environment to assess their effectiveness. |
Selecting and refining the best solution | Choosing the most viable solution based on testing results and refining it. |
Performing risk assessments | Evaluating potential risks associated with the implementation of solutions. |
Planning and executing implementation | Developing a detailed plan for rolling out the chosen solution effectively. |
Teams that follow these steps create solutions that solve the real problem and fit the needs of the business.
Implementation
Implementation turns the chosen solution into action. Teams develop a clear plan that outlines each step of the rollout. They assign tasks, set deadlines, and communicate the plan to everyone involved. Training sessions help team members learn new procedures or tools.
Teams monitor the process closely during implementation. They collect feedback and make adjustments if needed. This approach ensures the solution works as intended and delivers the expected results. Teams document changes and update process maps or instructions. They also prepare to move into the Control phase, where they will focus on maintaining the gains.
Careful planning and strong communication help teams implement solutions smoothly and avoid setbacks.
Control
Sustaining Results
The Control phase helps teams keep improvements in place over time. Teams use several methods to monitor the process and prevent old problems from returning. Control charts track ongoing performance and show if the process stays within set limits. Process capability studies check if the process can meet quality standards. Control plans outline how to monitor and control the process long-term.
Teams update work instructions and standard operating procedures (SOPs) to lock in improvements. They schedule periodic audits to make sure the process remains stable. Management reviews help leaders stay informed and support ongoing control.
Control charts track ongoing performance and identify variations.
Process capability studies evaluate the ability of the process to produce acceptable output.
Control plans outline how to monitor and control the process long-term.
Updates to work instructions and SOPs lock in improvements.
Periodic audits ensure the process remains in control.
Teams that use these methods can maintain high quality and avoid slipping back into old habits.
Standardization
Standardization ensures that everyone follows the improved process the same way. Teams create or update SOPs to describe each step clearly. They develop dashboards or scorecards to visualize performance metrics and track improvements over time. Training and documentation help all team members understand and follow the new standards.
The table below highlights key methods for standardization:
Method | Purpose |
|---|---|
Creating or updating standard operating procedures (SOPs) | To ensure consistent execution of improved processes. |
Developing monitoring dashboards or scorecards | To visualize performance metrics and track improvements over time. |
Using control charts to track ongoing performance | To monitor process stability and identify any deviations from expected performance. |
Providing training and documentation for stakeholders | To ensure all team members are informed and capable of maintaining improvements. |
Formalizing project handover to process owners | To ensure accountability and ownership of the improved processes. |
Teams formalize the handover of the improved process to process owners. This step ensures accountability and long-term success. Regular training and clear documentation help new team members learn the process quickly.
Standardization builds a culture of consistency and continuous improvement. Teams that follow these steps keep their gains and support future success.
Six Sigma Tools and Techniques

Process Mapping
Process mapping stands as a foundational tool in Six Sigma projects. Teams use process maps to create a visual representation of each step in a workflow. This approach helps everyone see how work moves from start to finish. By breaking down processes into smaller parts, teams can spot bottlenecks, redundant steps, and areas that waste time or resources.
Process mapping offers several benefits:
Visualizes workflows, making inefficiencies easier to identify.
Breaks down complex processes into manageable components.
Enhances communication among team members and stakeholders.
Aligns efforts toward shared goals.
Teams often see measurable improvements after using process mapping. The table below highlights some quantified impacts:
Benefit | Quantified Impact |
|---|---|
Waste Reduction | 30% reduction |
Cycle Time Improvement | 20% improvement |
Customer Complaints Reduction | 25% reduction |
Product Returns Decrease | 15% decrease |
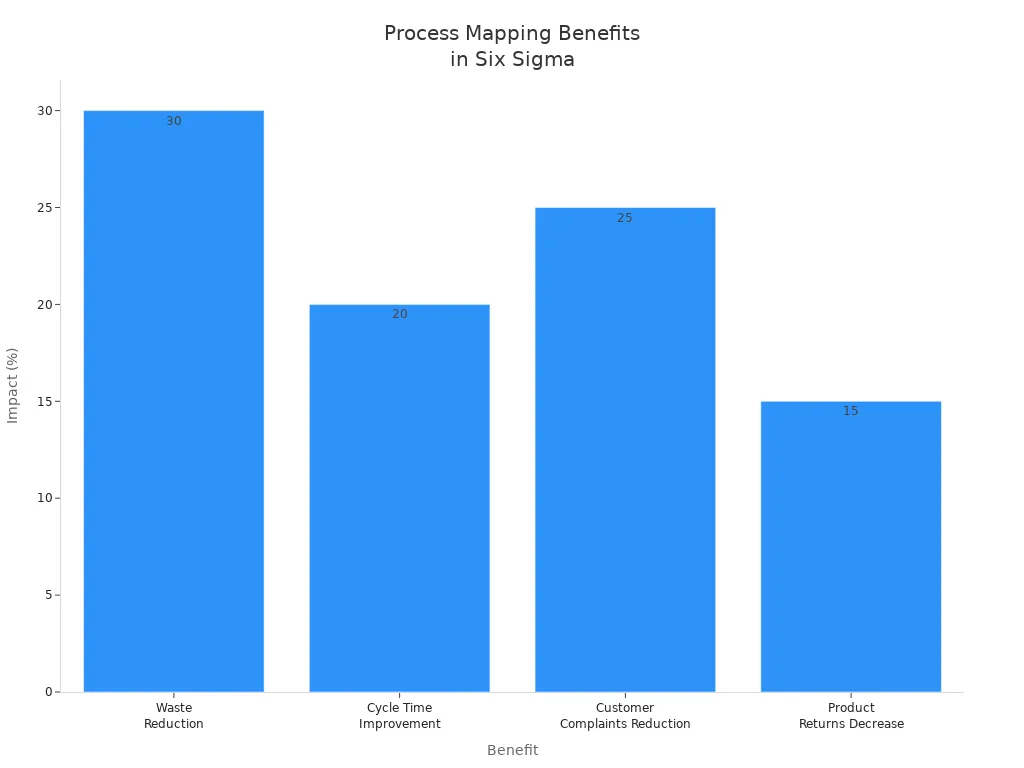
Process mapping gives teams a clear picture of where to focus improvement efforts.
Cause-and-Effect Diagram
The cause-and-effect diagram, also known as the fishbone or Ishikawa diagram, helps teams identify the root causes of problems. This tool organizes possible causes into categories such as materials, methods, measurements, environment, people, and machines. By visually displaying all potential causes, teams can explore every possibility and avoid missing key issues.
Evidence Type | Description |
|---|---|
These diagrams visually display all the potential causes for a particular effect or problem. They are useful for thoroughly exploring all possibilities for cause identification and root cause analysis. |
Teams use this diagram during brainstorming sessions. They write the problem at the head of the "fish" and draw branches for each major category. Smaller branches show specific causes. This structure helps teams organize their thoughts and focus on finding the true source of a problem.
The cause-and-effect diagram encourages thorough investigation and supports effective problem-solving.
Control Charts
Control charts play a key role in monitoring process stability. Teams use these charts to plot data points over time, which helps them see if a process stays within set limits. Each chart includes a center line for the average and upper and lower control limits. When data points fall outside these limits, it signals that something unusual may be happening.
Control charts help teams:
Detect patterns or trends that could indicate problems.
Distinguish between normal variation and issues that need attention.
Maintain process stability and predictability.
By using control charts, teams can quickly respond to changes and keep processes under control. This tool supports ongoing quality improvement and helps prevent defects from returning.
Control charts give teams the ability to monitor performance and ensure long-term success in Six Sigma projects.
Pareto Analysis
Pareto Analysis helps teams in Six Sigma projects decide where to focus their efforts. This tool uses the idea that a small number of causes often lead to most problems. Teams use Pareto charts to organize data from highest to lowest frequency. This makes it easy to see which issues happen most often.
A Pareto chart is a type of bar graph. It shows the most common problems on the left and less common ones on the right. The chart also includes a line that shows the total impact of each problem. Teams can quickly spot the biggest issues and decide which ones to fix first.
The table below explains how Pareto Analysis works:
Evidence Description | Explanation |
|---|---|
Pareto charts order data from highest to lowest frequencies | This helps teams identify the most significant causes or defects, allowing for prioritization of areas that will yield the greatest improvements. |
A Pareto chart is a statistical process tool for prioritizing significance | It visually represents data in descending order of importance, enabling organizations to focus on the most impactful issues first. |
Teams often find that about 20% of causes lead to 80% of problems. By focusing on these key causes, teams can make the biggest improvements with the least effort. For example, if a company sees that most customer complaints come from just two types of errors, they can fix those first.
Pareto Analysis saves time and resources. Teams do not waste effort on small issues that have little effect. Instead, they target the main sources of trouble. This approach leads to faster results and better use of resources.
Pareto Analysis gives teams a clear way to set priorities and achieve quick wins in Six Sigma projects.
FMEA
Failure Mode and Effects Analysis (FMEA) is a tool that helps teams find and prevent possible failures in a process or product. Teams use FMEA to look at each step and ask, "What could go wrong?" They then list the possible causes and effects of each failure.
FMEA helps teams rate each failure by how likely it is, how severe the effect would be, and how easy it is to detect. Teams use these ratings to decide which risks need the most attention. This method helps teams prevent problems before they happen.
The table below shows how FMEA supports risk management in Six Sigma:
Aspect | Description |
|---|---|
Purpose | Identifies potential failures, their causes, and effects. |
Risk Prioritization | Helps prioritize risks and implement preventive actions. |
Contribution to Six Sigma | Enhances product/process reliability and manages risks effectively in Six Sigma initiatives. |
FMEA offers several benefits:
Evaluates potential failure modes, their causes, and effects.
Prioritizes improvement actions by identifying high-risk failures.
Prevents issues by focusing on critical risks.
Teams use FMEA early in a project to avoid costly mistakes. They update the analysis as they learn more about the process. This tool helps teams build safer, more reliable products and processes.
FMEA supports a proactive approach to quality and risk management in Six Sigma projects.
Implementing Six Sigma Methodology
Building a Team
A successful Six Sigma initiative starts with building a strong team. Each member plays a unique role in driving process improvement. Organizations select individuals based on their skills, experience, and willingness to learn. The table below outlines the essential roles and their responsibilities:
Role | Description |
|---|---|
White belt | Beginner level, helps lead teams with problem-solving and implementing Six Sigma culture. |
Yellow belt | Familiar with tools and jargon, works under green/black belts, creates process maps and gathers data. |
Green belt | Core team members, lead waste identification and improvements, require significant training. |
Black belt | Full-time practitioners, manage multiple teams, mentor others, and master process improvement. |
Master black belt | Highest level, leads teams, communicates with executives, and mentors lower belts. |
Team leaders often select members from different departments. This approach brings diverse perspectives and skills to the project. White belts and yellow belts support data collection and mapping. Green belts and black belts focus on leading projects and solving complex problems. Master black belts guide the overall strategy and mentor other team members.
A well-structured team increases the chances of project success and helps spread a culture of continuous improvement.
Training and Certification
Training and certification form the foundation for effective Six Sigma Methodology. Organizations invest in structured programs to teach team members the tools and techniques needed for success. Recognized certification levels include Green Belt, Black Belt, and Master Black Belt. Each level builds on the previous one and adds new skills.
Key benefits of Six Sigma training and certification include:
Measurable financial results often appear within 3-6 months of implementation.
Significant improvements become evident within the first year.
Initial projects usually generate savings that exceed training and implementation costs.
Most successful projects aim for completion within 4-6 months.
The table below highlights the advantages of advanced certification:
Certification Level | Key Benefits |
|---|---|
Master Black Belt | - Advanced approach to Lean Six Sigma projects |
- Expertise in statistical methods | |
- Opportunities for career growth | |
- Leadership and teaching capabilities |
Training programs focus on reducing process variation, eliminating defects, and improving quality and efficiency. They emphasize data-driven decision-making and continuous improvement. Certified team members use these skills to achieve near-perfect quality levels.
Well-trained teams deliver better results and help organizations reach their business goals faster.
Project Selection
Selecting the right projects is critical for the success of Six Sigma Methodology. Leaders use clear criteria to choose projects that align with business strategy and deliver measurable results. The table below summarizes the main criteria for project selection:
Criteria | Description |
|---|---|
Strategic Alignment | Projects must align with the organization's strategic goals to ensure relevance and impact. |
High Impact on Business Processes | Prioritize projects that significantly affect critical business processes for maximum benefit. |
Clear Objectives | Each project should have well-defined objectives to guide implementation and measure success. |
Measurable Outcomes | Outcomes should be quantifiable to assess the effectiveness of the Six Sigma initiatives. |
Teams select projects that support the company’s long-term vision. They look for opportunities to improve processes that affect customers, costs, or quality. Leaders set clear objectives and define how they will measure success. This approach ensures that every project delivers value and supports continuous improvement.
Careful project selection helps organizations focus resources on the most important opportunities for growth.
Integration with Strategy
Successful organizations align Six Sigma initiatives with their overall business strategy. Leaders set clear goals that match the company’s vision. They make sure every Six Sigma project supports these goals. This alignment helps teams focus on what matters most for growth and improvement.
Teams use several methods to connect Six Sigma with strategy:
Fostering a culture of continuous improvement encourages all employees to identify and solve problems. Leaders reward innovation and support new ideas.
Empowering teams through training enhances efficiency and effectiveness across the organization. Well-trained employees understand how their work fits into larger business goals.
Utilizing data-driven decision-making shifts from intuition-based to evidence-based strategies. Teams use facts to guide actions, which improves accuracy and effectiveness.
Leaders communicate the importance of Six Sigma at every level. They link project outcomes to strategic objectives, such as customer satisfaction, cost reduction, or market growth. This approach ensures that everyone works toward the same targets.
When Six Sigma becomes part of the business strategy, organizations see faster progress and stronger results.
Tracking Success
Tracking the success of Six Sigma initiatives helps organizations measure progress and sustain improvements. Teams use a mix of metrics and tools to monitor performance and guide future actions.
Metric | Description |
|---|---|
Key Performance Indicators (KPIs) | Metrics such as defect rates, cycle time, and process capability indices (Cpk) that provide insights into project progress and impact. |
Control Charts | Tools used to monitor process stability over time, essential for sustaining improvements. |
Variance Analysis | Helps identify fluctuations from expected performance, aiding in understanding project effectiveness. |
Teams also use several practical tools to track results:
Process Mapping (Flowcharts): Visualizes the sequence of steps in a process.
Check Sheets: Structured forms for real-time data collection.
Pareto Chart: Identifies the most significant issues affecting quality.
A structured approach helps teams follow each step of the Six Sigma process:
Define: Establish project goals and customer requirements.
Measure: Collect data to understand current performance.
Analyze: Identify root causes of defects.
Improve: Implement solutions to address root causes.
Control: Monitor improvements to sustain gains.
Regular reviews help leaders and teams see what works and where to improve. They adjust strategies based on data, not guesses. This practice keeps the organization on track and supports long-term success.
Consistent tracking ensures that Six Sigma delivers lasting value and supports continuous improvement.
Overcoming Challenges
Change Resistance
Many employees feel uncertain when organizations introduce Six Sigma Methodology. Change often brings discomfort. People may worry about job security or fear new responsibilities. Teams sometimes resist new processes because they feel attached to old habits. Leaders can address this resistance by explaining the benefits of Six Sigma. They should share success stories and show how improvements make daily work easier.
Open communication helps reduce fear. Leaders answer questions and listen to concerns. Training sessions give employees the skills they need to succeed. When teams see positive results, they become more willing to support change. Recognition and rewards for early adopters can also encourage others to join in.
Tip: Leaders should involve employees early in the process. This approach builds trust and helps everyone feel valued.
Leadership Support
Strong leadership support drives the success of Six Sigma projects. Leaders set the tone for the entire organization. They provide resources, remove obstacles, and keep teams focused on goals. Without leadership backing, projects often lose momentum.
Leaders must show commitment by participating in training and project reviews. They should communicate the importance of Six Sigma to all staff. When leaders celebrate milestones and recognize achievements, teams feel motivated to continue their efforts.
A table below highlights key actions leaders can take:
Leadership Action | Impact on Six Sigma Success |
|---|---|
Provide resources | Ensures teams have tools and time |
Communicate vision | Aligns everyone with business goals |
Recognize achievements | Boosts morale and motivation |
Remove barriers | Helps teams overcome obstacles |
Note: Leadership involvement signals that Six Sigma is a priority, not just a passing trend.
Common Pitfalls
Organizations face several common pitfalls when applying Six Sigma Methodology. Teams sometimes skip steps in the DMAIC process. This shortcut can lead to incomplete solutions. Others may focus too much on tools and forget about the people involved. Lack of clear goals or poor project selection can waste time and resources.
Some teams collect too much data without using it effectively. Others fail to sustain improvements after initial success. Regular reviews and updates help prevent backsliding. Teams should avoid taking on too many projects at once. Focusing on a few high-impact projects leads to better results.
A checklist for avoiding pitfalls:
Set clear, measurable goals.
Follow each DMAIC step carefully.
Involve employees at every stage.
Use data to guide decisions.
Review progress regularly.
Celebrate small wins to maintain momentum.
Teams that watch for these pitfalls can keep projects on track and achieve lasting improvements.
Sustaining Improvement
Sustaining improvement stands as a critical step in the Six Sigma journey. Teams often achieve impressive results during initial projects. However, maintaining these gains requires ongoing effort and discipline. Many organizations struggle to keep improvements in place after the excitement of a project fades. Leaders and teams must use proven strategies to ensure lasting success.
Teams use several methods to sustain improvement:
Standard Operating Procedures (SOPs): Teams document new processes in clear instructions. SOPs help everyone follow the same steps and prevent old habits from returning.
Regular Training: Employees receive ongoing training to reinforce new skills. Training keeps everyone updated on best practices.
Performance Monitoring: Teams track key metrics using dashboards and control charts. Monitoring helps spot problems early and maintain quality.
Audits and Reviews: Leaders schedule periodic audits to check compliance. Reviews provide feedback and highlight areas for further improvement.
Continuous Feedback: Employees share suggestions and report issues. Feedback loops encourage quick responses to new challenges.
Tip: Teams that use feedback and monitoring tools can catch small issues before they become big problems.
A table below shows common tools for sustaining improvement:
Tool | Purpose | Benefit |
|---|---|---|
Control Charts | Monitor process stability | Early detection of variation |
Dashboards | Visualize performance metrics | Quick access to data |
SOPs | Standardize procedures | Consistent execution |
Training Programs | Reinforce skills and knowledge | Higher employee competence |
Audits | Check compliance and effectiveness | Identify gaps and risks |
Leaders play a key role in sustaining improvement. They set clear expectations and provide resources for ongoing monitoring. Managers recognize achievements and encourage a culture of continuous improvement. Teams celebrate milestones to maintain motivation.
Organizations also use visual management tools. Signs, charts, and scorecards make performance visible to everyone. Visual cues remind employees of standards and goals.
Sustaining improvement requires commitment from all levels. Teams must stay alert and adapt to changes in the business environment. Leaders support this effort by promoting open communication and rewarding proactive behavior.
Note: Sustaining improvement ensures that Six Sigma delivers long-term value. Teams that follow these strategies build a foundation for future success.
Actionable Tips for Success
Quick Wins
Teams can build momentum with Six Sigma by targeting quick wins. These early successes help boost confidence and show the value of process improvement. Quick wins often come from small changes that deliver visible results.
Identify repetitive tasks that cause delays.
Standardize simple procedures to reduce errors.
Use checklists to improve accuracy in daily work.
Organize workspaces to remove clutter and save time.
Address common customer complaints with simple fixes.
Tip: Teams should celebrate each quick win. Recognition encourages everyone to support future projects.
A table below shows examples of quick wins and their impact:
Quick Win Example | Measurable Impact |
|---|---|
Standardized checklists | 20% reduction in errors |
Workspace organization | 15% faster task completion |
Addressing top complaint | 25% fewer customer calls |
Continuous Improvement Culture
A continuous improvement culture helps organizations sustain Six Sigma gains. Leaders set the tone by encouraging open communication and learning. Teams share ideas and look for ways to improve every day.
Hold regular team meetings to discuss progress.
Encourage employees to suggest improvements.
Provide ongoing training on Six Sigma tools.
Use visual boards to track goals and results.
Recognize and reward creative solutions.
Note: A culture of improvement grows when leaders listen and respond to feedback.
Teams that practice continuous improvement adapt quickly to change. They spot problems early and act before issues grow. This approach keeps quality high and supports long-term success.
External Resources
External resources support teams as they learn and apply Six Sigma. Many organizations use outside help to speed up training and solve complex problems.
Online courses and webinars teach Six Sigma basics.
Books and guides explain tools and methods in detail.
Professional associations offer certification and networking.
Consultants provide expert advice for tough projects.
Industry forums share best practices and case studies.
A list of helpful resources:
Resource Type | Example |
|---|---|
Online Training | Coursera, edX, ASQ Learning |
Books | "The Six Sigma Handbook" by Thomas Pyzdek |
Professional Groups | American Society for Quality (ASQ) |
Forums | iSixSigma Community, LinkedIn Groups |
Teams that use external resources gain new skills and stay updated on best practices.
By following these tips, organizations can achieve early wins, build a culture of improvement, and access valuable knowledge. These steps help ensure long-term success with Six Sigma.
Six Sigma Methodology helps teams achieve measurable improvements in quality and efficiency. Teams follow clear steps: define problems, measure performance, analyze causes, improve processes, and control results. A structured, data-driven approach supports lasting business success. Teams can start with small projects or training. Continuous improvement leads to long-term growth.
For more information or support, readers can reach out to learn how to apply these strategies in their own organizations.
FAQ
What is Six Sigma?
Six Sigma is a data-driven methodology that helps organizations improve quality and reduce defects. Teams use statistical tools to analyze processes and make changes that lead to measurable results.
Who should participate in Six Sigma projects?
Employees from different departments join Six Sigma teams. Leaders select members based on skills and experience. Each person plays a role, from data collection to process improvement.
How long does a typical Six Sigma project take?
Most Six Sigma projects finish within four to six months. Teams follow structured steps to define problems, measure performance, analyze causes, improve processes, and control results.
What are the main benefits of Six Sigma?
Six Sigma increases efficiency, reduces costs, and improves customer satisfaction. Organizations see fewer defects and faster delivery times. Teams achieve measurable gains in quality and performance.
Do companies need certification to use Six Sigma?
Certification helps teams learn Six Sigma tools and methods. Many organizations invest in training for Green Belt, Black Belt, or Master Black Belt levels. Certified members lead projects and mentor others.
Can Six Sigma work in non-manufacturing industries?
Six Sigma applies to many industries, including healthcare, finance, and service sectors. Teams use the same tools to improve processes, reduce errors, and enhance customer experience.
What tools do Six Sigma teams use?
Teams use process mapping, cause-and-effect diagrams, control charts, Pareto analysis, and FMEA. These tools help identify problems, analyze data, and monitor improvements.
How do organizations sustain improvements after a project?
Teams document new procedures, provide regular training, and monitor key metrics. Leaders schedule audits and reviews. Continuous feedback helps maintain gains and supports future success.


